Weekly issue · Nov 2–8, 2026

Week 45, 2026

16 curated papers

Spectroscopy-informed Deep Learning Searches for Photometric Little Red Dots in JWST Surveys

Chenxuan Zhang, Huanian Zhang, Qingwen Wu

A two-stage, spectroscopy-informed NIRCam classifier finds LRD candidates beyond standard color selections. Held-out recall/precision are 0.92/0.79, while broad Hα in 10 of 13 grating-observed candidates supports—without confirming—the LRD interpretation of many new selections.

What changes Rather than applying colors directly, this work transfers spectroscopic information into imaging representations. It reports 35 spectroscopic-sample candidates, 357 from Dawn JWST Archive imaging, and 23 from two further surveys. Candidates span broader observed SED properties than existing samples, which the authors interpret as possible evidence that color selection misses diversity. Recovery of one reported candidate in each of SAPPHIRES and BEACON supports cross-survey applicability, not a measured recovery fraction.
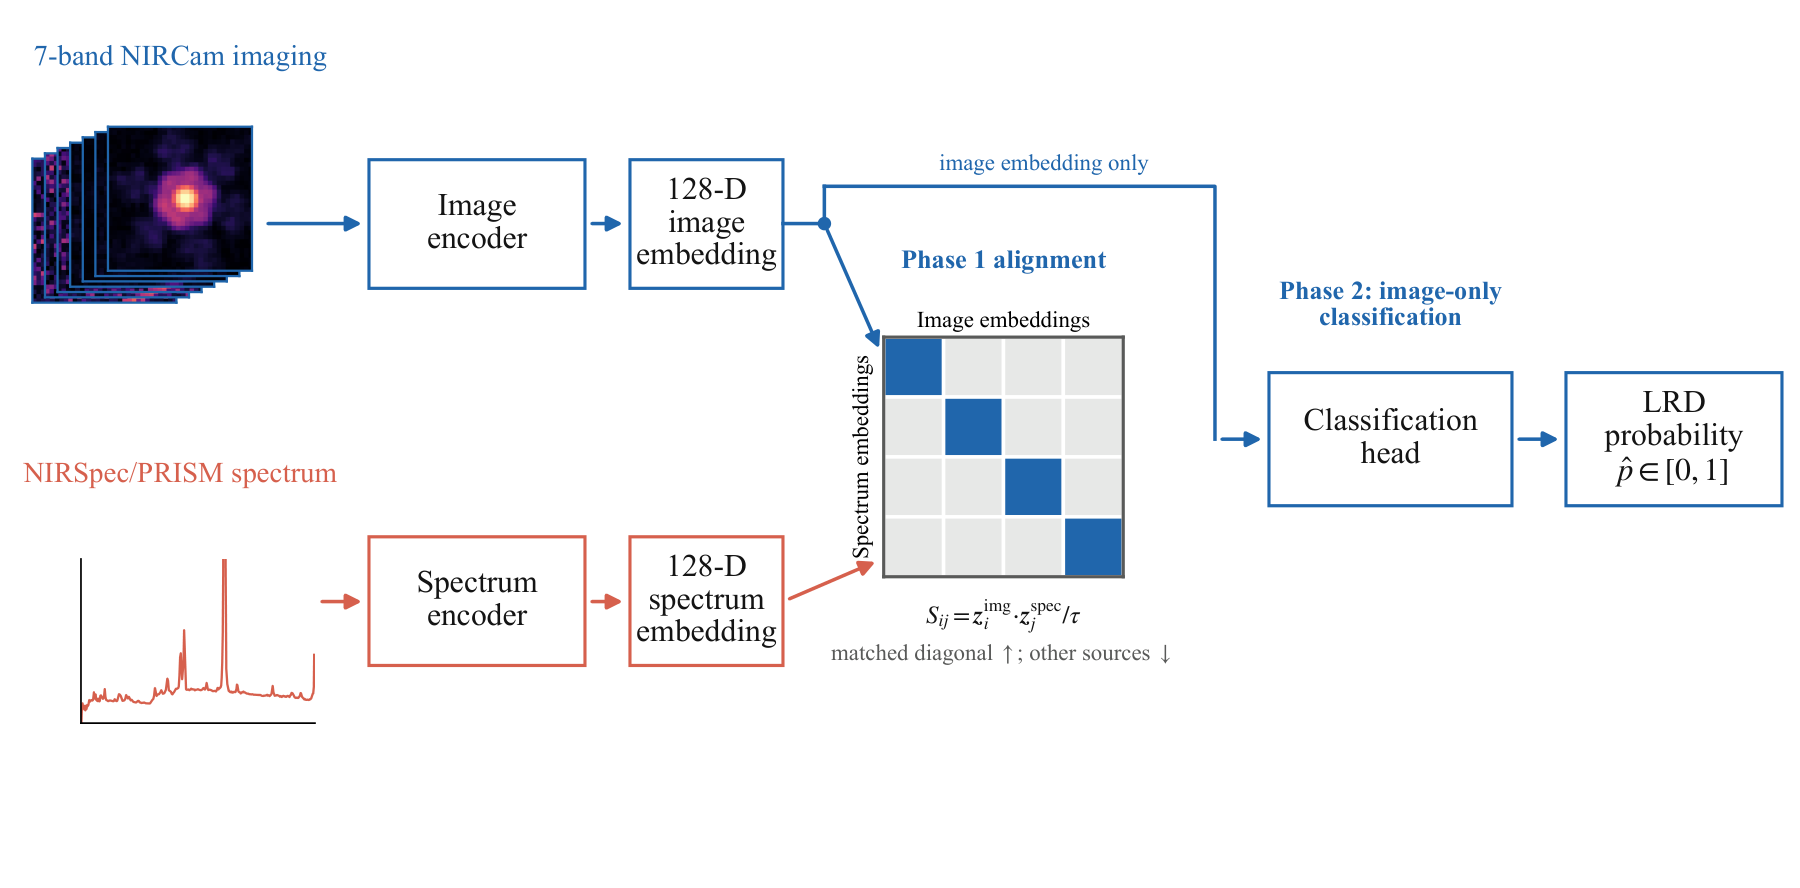
Figure 1 from Spectroscopy-informed Deep Learning Searches for Photometric Little Red Dots in JWST SurveysFigure 1 · Open paper
Figure notes (3)
  • Figure 1. Tests the methodological premise: PRISM spectral and NIRCam image embeddings are contrastively aligned before an image-only head is trained, so spectroscopy informs training rather than inference.
  • Figure 5. Tests spectroscopic support for model-selected candidates by fitting Hα with minimum-BIC continuum-plus one- or two-Gaussian models; displayed 1σ spectral uncertainties and broad-component widths show the basis for the broad-line classification.
  • Figure 7. Tests whether selected candidates occupy the observed F444W-magnitude–redshift region of known spectroscopic LRDs; it mixes spectroscopic redshifts where available with photometric redshifts otherwise.
Ly$α$ in Compact Broad-Line Emitters, Including Little Red Dots, Is More Closely Linked to the Host Galaxy than to the Broad-Line Nucleus

Yongda Zhu, Zheng Ma, Xiaojing Lin et al.

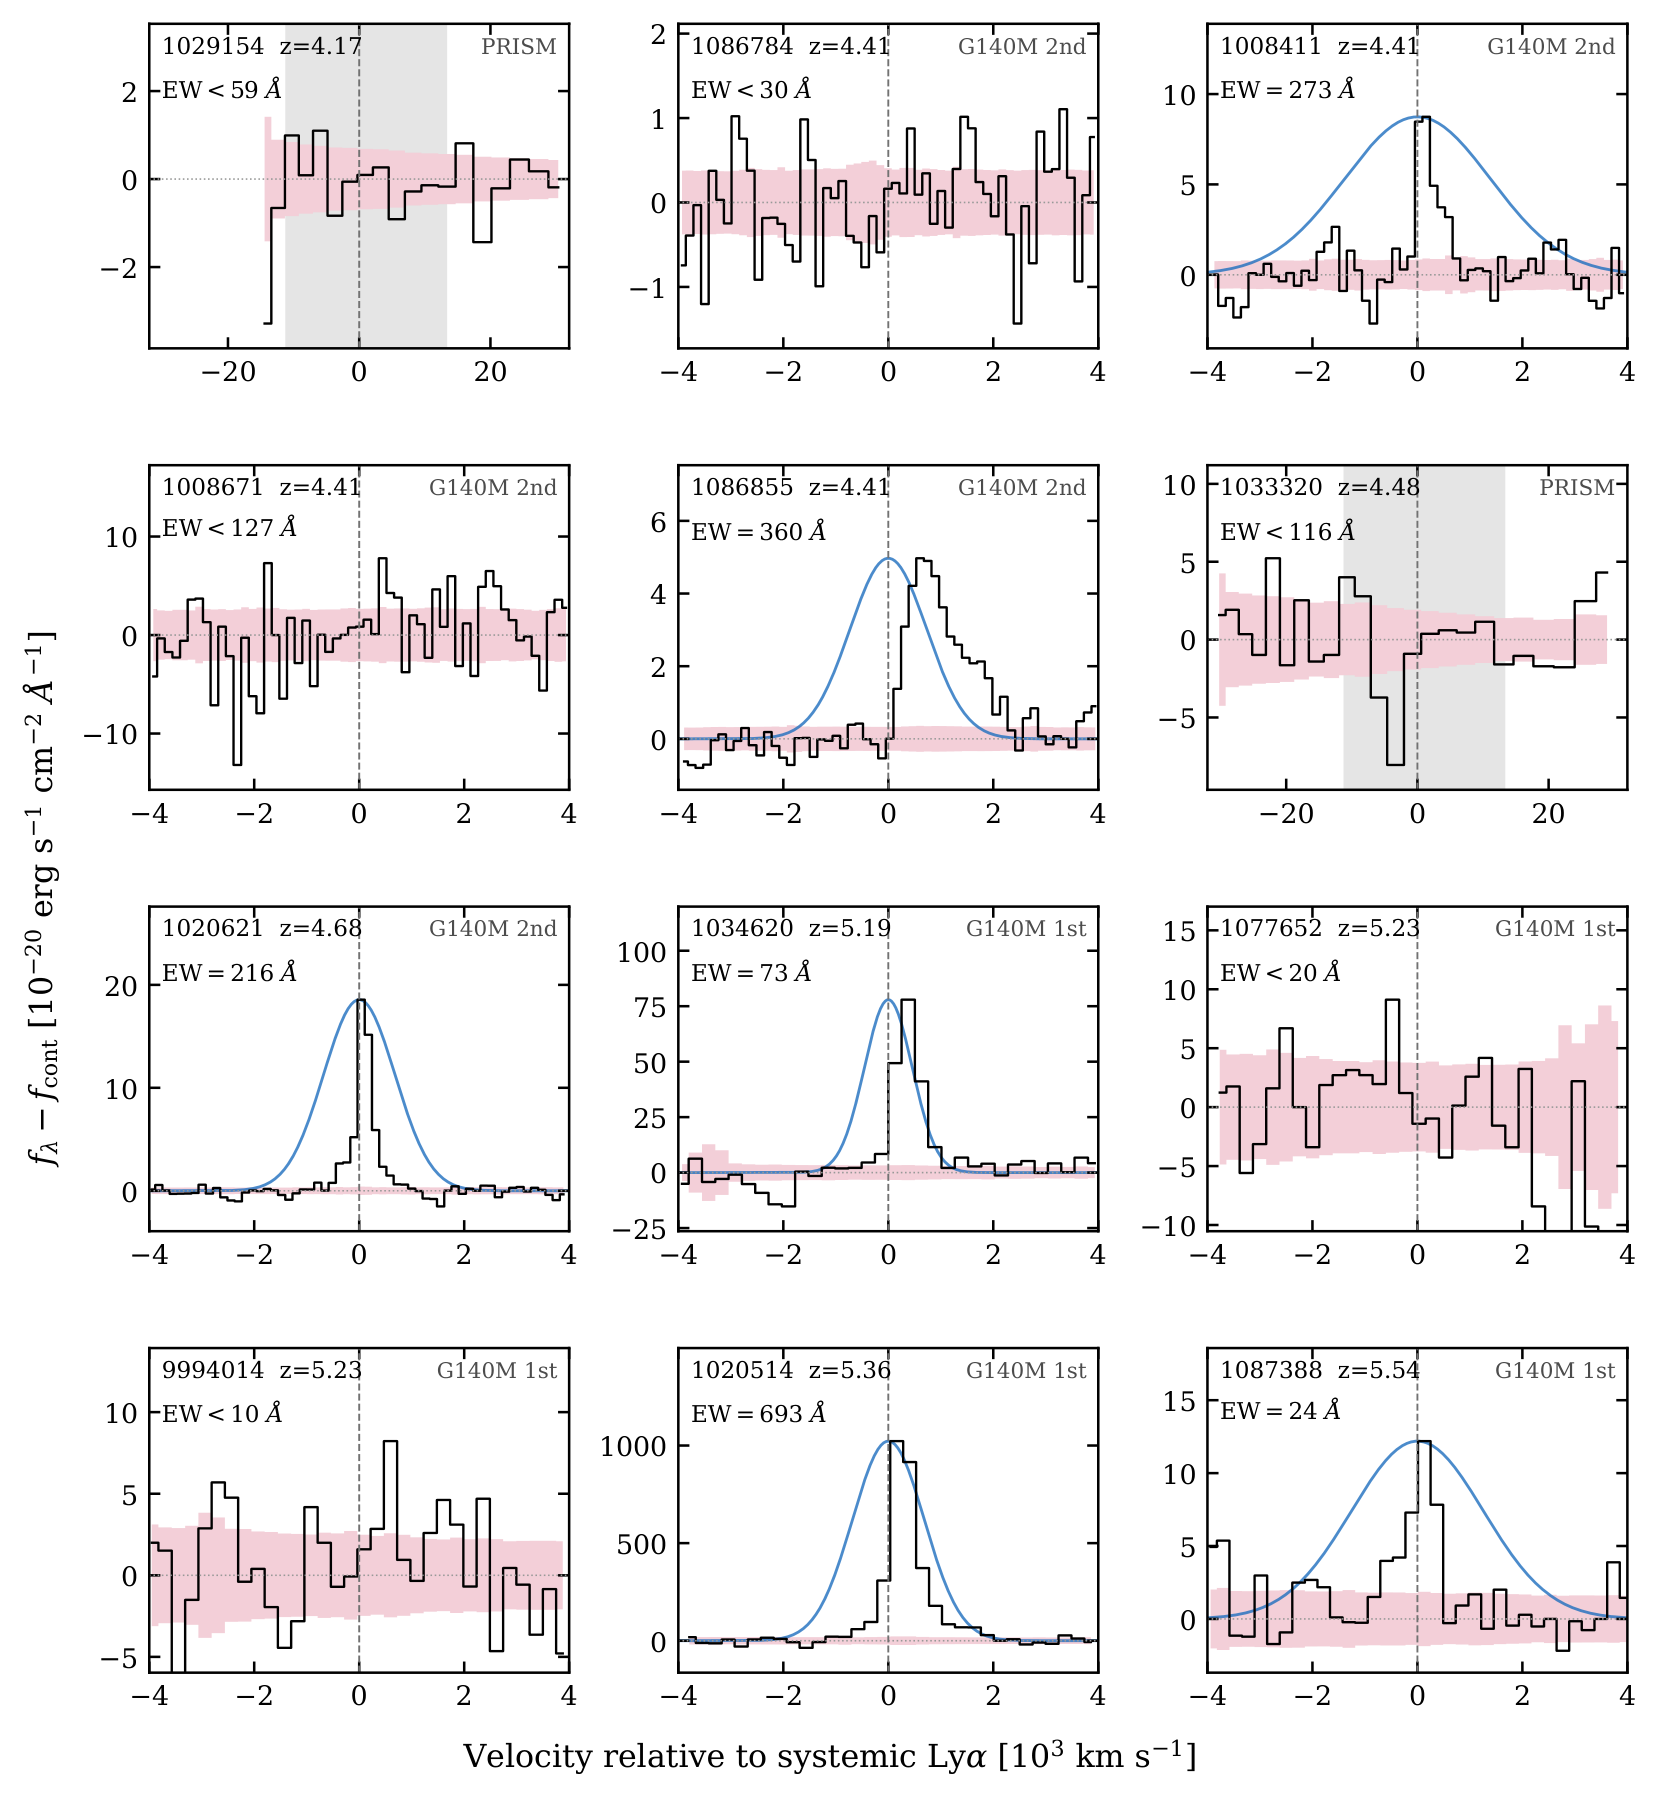
In 12 z=4.17–5.54 compact broad-line emitters, Lyα is detected in six and is systematically narrower than broad Hα. Host-SED predictions correlate more closely with observed Lyα than nuclear Hα/UV, although excess Lyα permits nuclear emission.

What changes After subtracting an AGN component, the authors fit dust-attenuated host SEDs without using Lyα spectroscopy or Lyα-containing photometry. Observed Lyα EW and luminosity, including upper limits, follow host-model Lyα more closely than Hα/UV. Yet each detection is 1.5–18 times the host-model Lyα prediction, so the result supports a host-linked observed component while leaving a nuclear contribution. The detected-source median effective Lyα escape fraction is ≈0.09.

Figure 1 from Ly$α$ in Compact Broad-Line Emitters, Including Little Red Dots, Is More Closely Linked to the Host Galaxy than to the Broad-Line NucleusFigure 1 · Open paper
Figure notes (3)
  • Figure 1. Tests the direct spectral measurement: continuum-subtracted Lyα profiles, rest-EWs, and 2σ nondetection limits for all 12 CBEs, with broad-Hα-width Gaussian comparisons for G140M detections.
  • Figure 4. Tests the host-link interpretation by comparing observed Lyα EW and luminosity with predictions of host SED fits that exclude Lyα spectral and photometric constraints; detections and upper limits are shown against equality.
  • Figure 5. Tests whether observed Lyα is BLR-width: all six detected Lyα lines are compared with broad-Hα FWHM, while instrumental broadening and the apparent half-width expected under blue-side absorption are indicated.

UV spectra of little red dots: Broad-line N/C, gas recycling and black hole masses

Albert Sneppen, Darach Watson, Lucy R. Ivey et al.

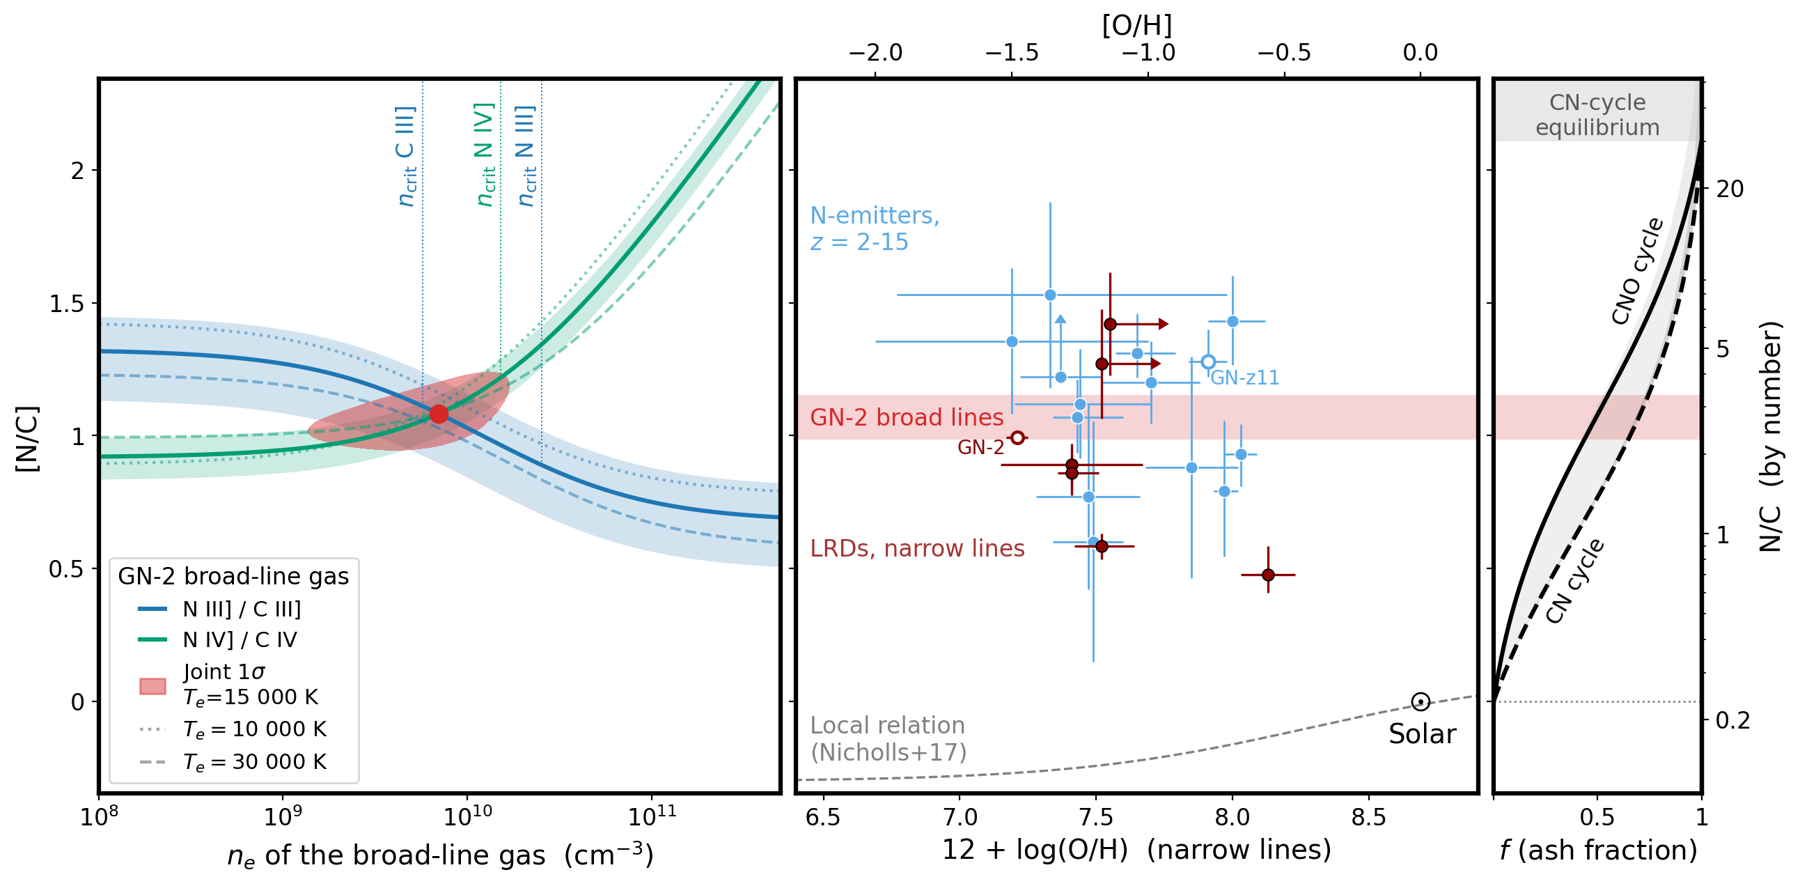
For SPURS-GN-2 at z=7.19, broad UV nitrogen-to-carbon lines imply strongly CNO-processed, dense gas; ionization-ordered absorption velocities are interpreted as a near-Eddington, decelerating cocoon flow around a 10^6–10^7 solar-mass black hole.

What changes Deep SPURS rest-UV spectra are used to connect broad-line abundance diagnostics with narrow absorption kinematics. In GN-2 and CEERS-7902, faster high-ionization absorption (for example C IV) than low-ionization Al II is matched by a radially decelerating, approximately ballistic model; for GN-2 the inferred effective gravity combined with luminosity favors near-Eddington accretion. The authors further interpret rapid cocoon-gas replacement and the nitrogen budget as favoring recycled gas—a partially failed wind—rather than a sustained escaping nitrogen-rich wind.

Figure 2 from UV spectra of little red dots: Broad-line N/C, gas recycling and black hole massesFigure 2 · Open paper
Figure notes (3)
  • Figure 2. Tests the abundance result by intersecting N III]/C III] and N IV]/C IV density-dependent constraints, then compares GN-2 N/C with narrow-line LRDs and high-redshift nitrogen emitters; its mixing panel translates N/C into a processed fraction.
  • Figure 4. Tests whether absorption centroids systematically vary with ionization potential. GN-2 and CEERS-7902 show fast C IV and slow Al II, the ordering predicted by the model for gas whose velocity decreases outward.
  • Figure 6. Tests the dynamical mass interpretation by intersecting luminosity-based ΓM_BH and deceleration-based M_BH(1−Γ) constraints, and contrasts them with broad-line estimates sensitive to electron-scattering broadening.

The STARfall pathway: forging intermediate-mass black holes through stellar collisions in dense star clusters

Filippo Simonato, Manuel Arca Sedda, Taeho Ryu et al.

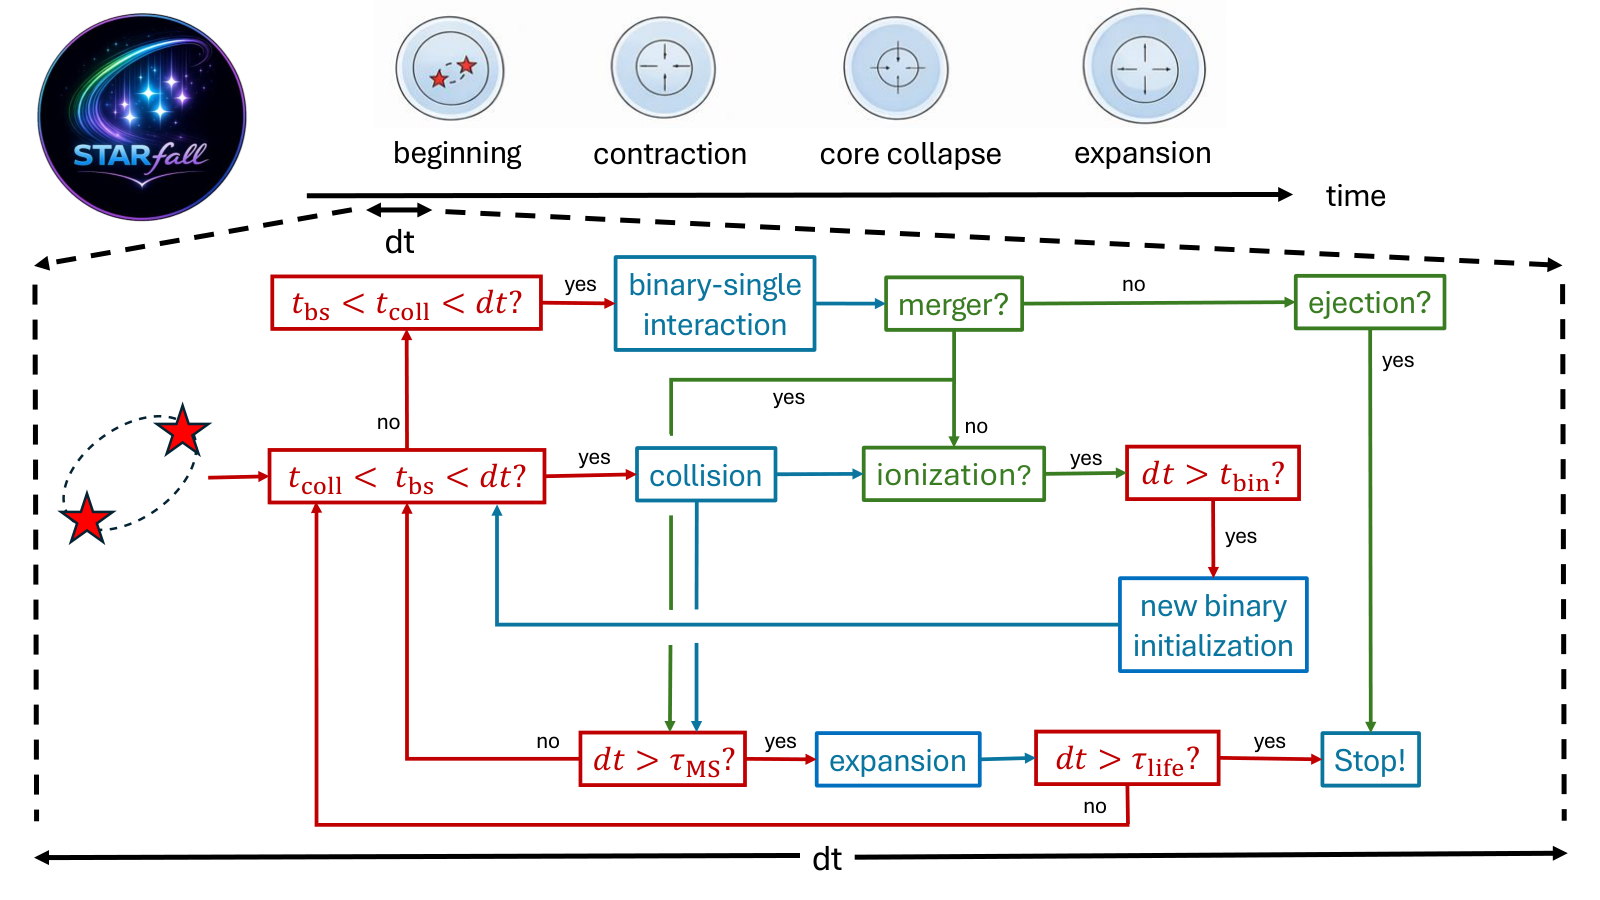
STARfall semi-analytically models collision-driven very massive stars in dense clusters, predicting 10^3–10^4 M⊙ IMBH seeds under favorable density and timescale conditions. Its Little Red Dot implication is conditional on unresolved systems being sufficiently compact stellar clusters.

What changes The paper connects this cluster calculation to Cosmic Gems Arc clusters, globular clusters, and LRD interpretations. Models resembling Cosmic Gems Arc clusters form ≥10^3 M⊙ VMSs in about 60% of cases. For putative LRD stellar clusters of 10^6–10^7 M⊙ and central densities 10^5–10^8 M⊙ pc⁻³, the reported seed interval is 10^3–10^4 M⊙; 10^8 M⊙ cases have lower median seed masses because core collapse is slower, and their >10^3 M⊙ probability is described as low and broad. Thus the result constrains a stellar-cluster interpretation of LRD structure, not an IMBH detection in any LRD. 【paper:2611.03812v1:3760802ffb45:107】【paper:2611.03812v1:3760802ffb45:109】

Figure 1 from The STARfall pathway: forging intermediate-mass black holes through stellar collisions in dense star clustersFigure 1 · Open paper
Figure notes (3)
  • Figure 1. Tests the modeled decision sequence: collision versus binary–single interaction, binary re-formation after ionization, stellar expansion, and termination at primary collapse.
  • Figure 3. Tests how terminal VMS mass varies with initial central density, cluster mass, and metallicity; its 50% and 90% shaded ranges display modeled population spread and it overlays several external simulation results.
  • Figure 8. Tests the mapping from cluster mass and radius to mean IMBH-seed mass after 5 Myr, placing Cosmic Gems Arc cluster measurements and globular-cluster comparison points against the pair-instability gap.

Black Hole Seeds and Little Red Dots: Connecting Formation and Growth with a JWST Multi-Cycle Treasury Program

Fabio Pacucci, Raffaella Schneider, Harley Katz et al.

This white paper proposes a coordinated, multi-cycle JWST program to determine whether Little Red Dots trace accreting black holes and to separate black-hole seeding signatures from later growth through uniform spectroscopy, imaging, and time-domain data.

What changes Rather than reporting a new observational sample, the paper specifies a survey design: repeatedly observe one uniformly selected parent population and obtain black-hole masses, accretion indicators, and host properties for the same objects. It argues that grating spectroscopy, deep MIRI imaging, and variability jointly enable self-consistent black-hole mass functions, Eddington-ratio distributions, and black-hole–host relations down to lower masses. The intended discrimination is between seed pathways, subsequent accretion histories, and competing LRD physical models.

On the importance of medium-resolution continuum spectroscopy for JWST's extragalactic legacy

Adam C. Carnall, Ho-Hin Leung, Struan D. Stevenson et al.

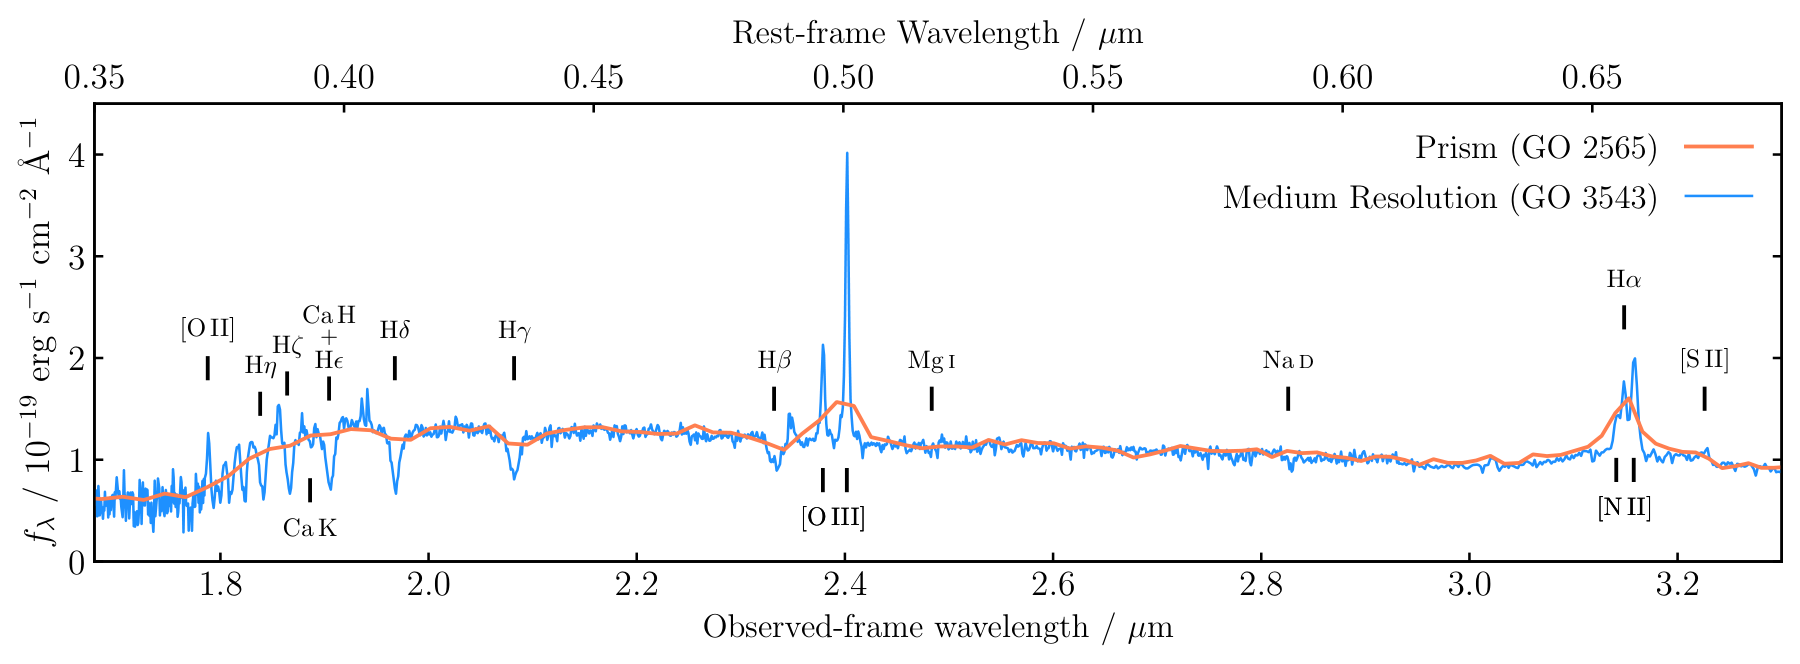
This planning paper argues that deep JWST/NIRSpec medium-resolution continuum spectroscopy can turn high-redshift galaxy surveys from emission-line detections into measurements of stellar populations, neutral gas, and kinematics; its empirical EXCELS-based exposure scaling motivates a 1,000-hour survey concept.

What changes The distinctive contribution is an empirically derived mapping from rest-optical apparent magnitude and NIRSpec medium-resolution exposure time to continuum S/N, claimed to be redshift-independent, plus a sketch 1,000-hour MSA program for a representative z>1.5 sample. The proposed observing goal is continuum S/N=20 per pixel, aimed at population-level scaling relations rather than solely individual line measurements. The authors estimate that, for an assumed intrinsic scatter of 0.2 dex, about 25 galaxies per mass–redshift bin yield mean values precise to about 0.04 dex; roughly 100 well-selected galaxies per redshift bin would populate four 0.3-dex mass bins from log10(M*/M⊙)=10.3–11.5.

Figure 1 from On the importance of medium-resolution continuum spectroscopy for JWST's extragalactic legacyFigure 1 · Open paper
Figure notes (2)
  • Figure 1. Tests the information lost at low resolution using a z=3.797 galaxy: prism R≈30–300 does not resolve Balmer-series structure around the 4000 Å break or the [O III]+Hβ and [N II]+Hα complexes, whereas medium resolution is intended to separate features used for ages, nebular properties, and kinematics.
  • Figure 2. Tests the empirical exposure-planning premise by plotting EXCELS rest-optical S/N per pixel against the NIRCam magnitude closest to rest-frame 0.55 μm. The stated measurement averages 0.51–0.64 μm rest frame and assesses whether the relation holds across redshift/grating choices.

Towards Self-consistent Modeling of Quasi-Stars and their NLTE Spectra: Implications for Little Red Dots

Jake B. Hassan, Rosalba Perna, Mitchell C. Begelman et al.

Coupled MESA evolution and TLUSTY NLTE atmospheres yield quasi-star spectra whose cool continua and Balmer breaks broadly resemble Little Red Dots, but the modeled absorption-line spectra do not explain their common strong emission lines.

What changes The central advance is a self-consistent evolution-to-atmosphere pipeline that, according to the authors, supplies the first converged NLTE TLUSTY models at expected quasi-star surface conditions and compositions. Unlike older models, its localized use of saturated convection removes the reported BH-mass ceiling and permits evolution to M_BH/M_star approximately 1. It also tests opacity treatment, metallicity, mixing length, and numerical suppression of a surface density inversion. Where atmospheric mixing-length settings differ from the MESA value for convergence, the authors report little spectral sensitivity because convection is inefficient in spectrum-forming layers.

Figure notes (3)
  • Figure 1. Tests evolutionary differences at fixed total mass 10^5 solar masses among the new MESA model, Hassan et al. model, and CB24 analytic predictions, including mid-envelope gas/radiation pressure and adiabatic index. Inner-radius boundary definitions differ, an important comparison caveat.
  • Figure 7. Tests the atmospheric consequence of NLTE by comparing the fiducial spectrum and H-alpha line directly with an LTE model at the same conditions; the reported outcome is stronger Balmer absorption in NLTE.
  • Figure 11. Tests continuum agreement with several LRDs for a midlife, varying-opacity 10^6-solar-mass model, normalized at 0.52 micrometres, with and without A_V=2 attenuation; strong attenuation generally makes the match poorer.

EMBER: A Little Red Dot Candidate at $z_{\rm spec}=10.36$ in the Seed Black Hole Era

Takumi S. Tanaka, Hollis B. Akins, John D. Silverman et al.

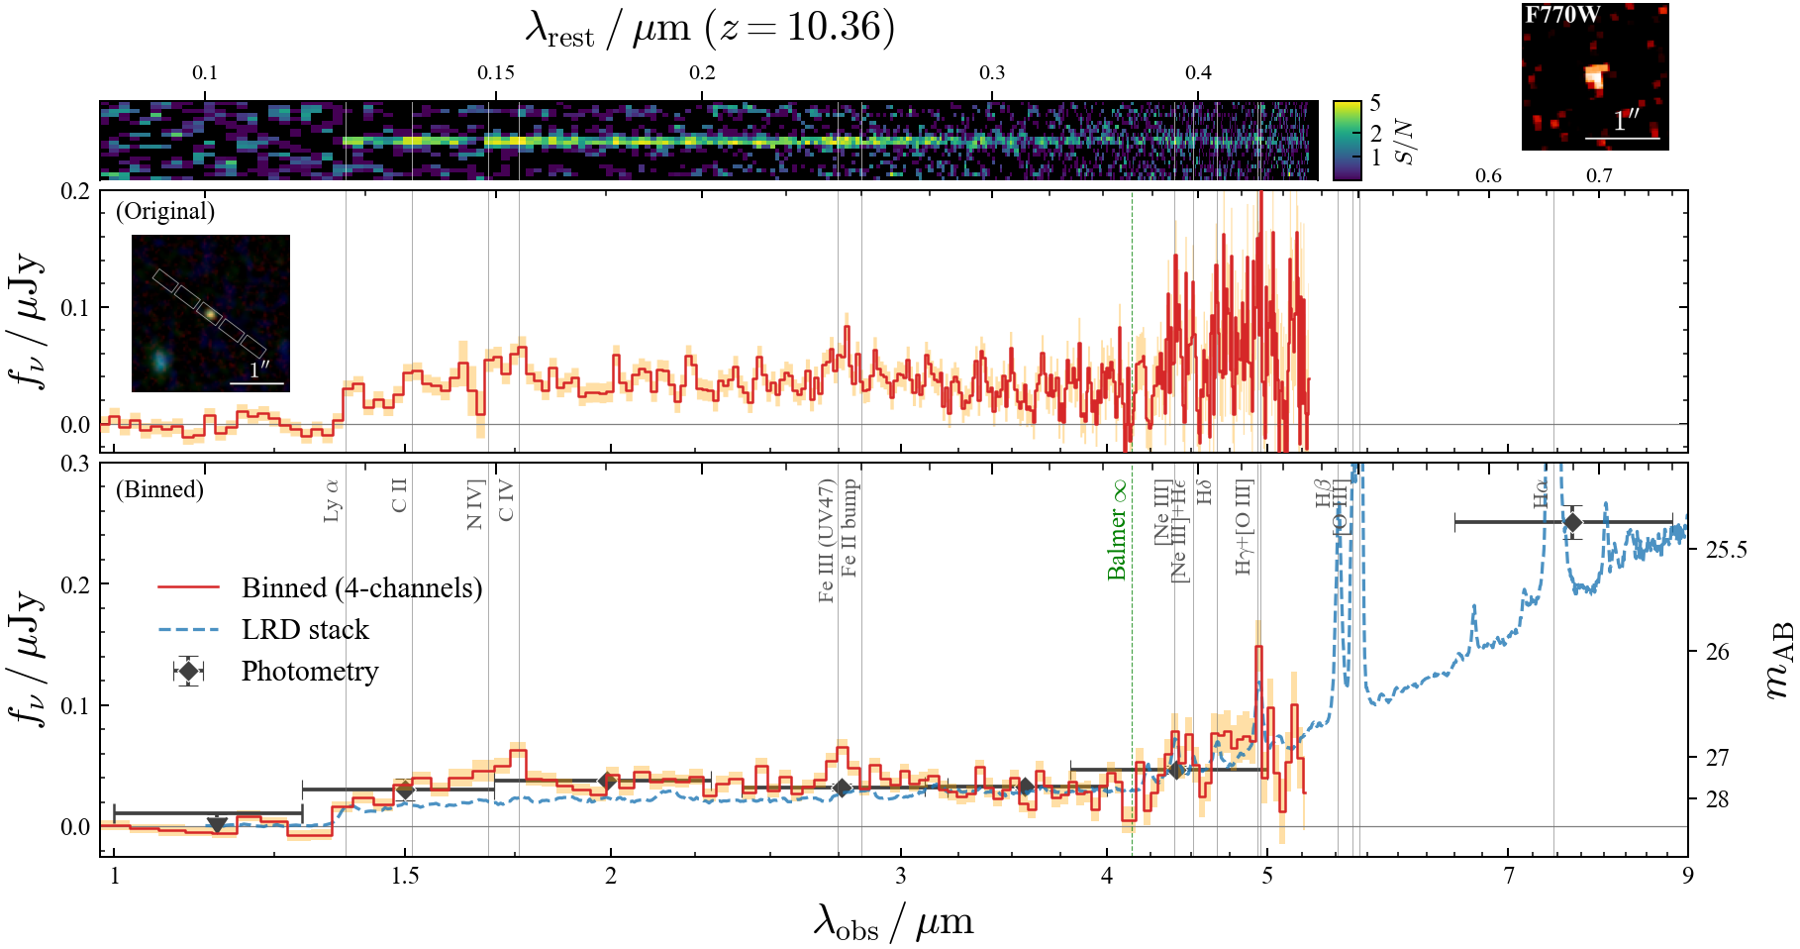
JWST/NIRSpec finds CW-LRD-z10 at zspec=10.361, with a Balmer-limit V-shaped continuum and tentative high-ionization/auroral lines. It is a strong z>10 LRD candidate, but present spectroscopy does not unambiguously establish either broad-line or AGN status.

What changes This paper extends spectroscopic redshift evidence for an LRD candidate to z=10.361 and tests its classification with both continuum fitting and rest-optical MIRI photometry. The authors argue that a stellar Balmer-break interpretation would need Hα EW≈(6±1)×10^3 Å to match F770W, exceeding the cited theoretical ≲4000 Å and typical extreme-emitter ≈2000 Å values. They further report possible UV iron and elevated [O III] λ4363/Hγ as AGN-like clues, not decisive AGN diagnostics.

Figure 1 from EMBER: A Little Red Dot Candidate at $z_{\rm spec}=10.36$ in the Seed Black Hole EraFigure 1 · Open paper
Figure notes (3)
  • Figure 1. Tests the basic spectral and photometric consistency of the source: nod-subtracted and optimally extracted PRISM spectra, four-channel binning, and comparison to a continuum-scaled stack of 274 LRDs. It visually assesses the Lyα break and V-shaped SED.
  • Figure 3. Places CW-LRD-z10 in MUV–redshift space against previously spectroscopically confirmed LRDs, testing whether its UV luminosity is exceptional relative to that comparison set. The text reports MUV=−20.16±0.07 and calls it comparable to the most UV-luminous LRDs.
  • Figure 4. Tests whether several weak line locations coherently favor the proposed redshift: mean/median stacks and leave-one-out fits peak near z≈10.36. This supports the line interpretation but does not turn the individual low-S/N features into secure detections.

A Supermagnified Little Red Dot with a Resolved Host

Jon Judež, Roberta Tripodi, Nicholas S. Martis et al.

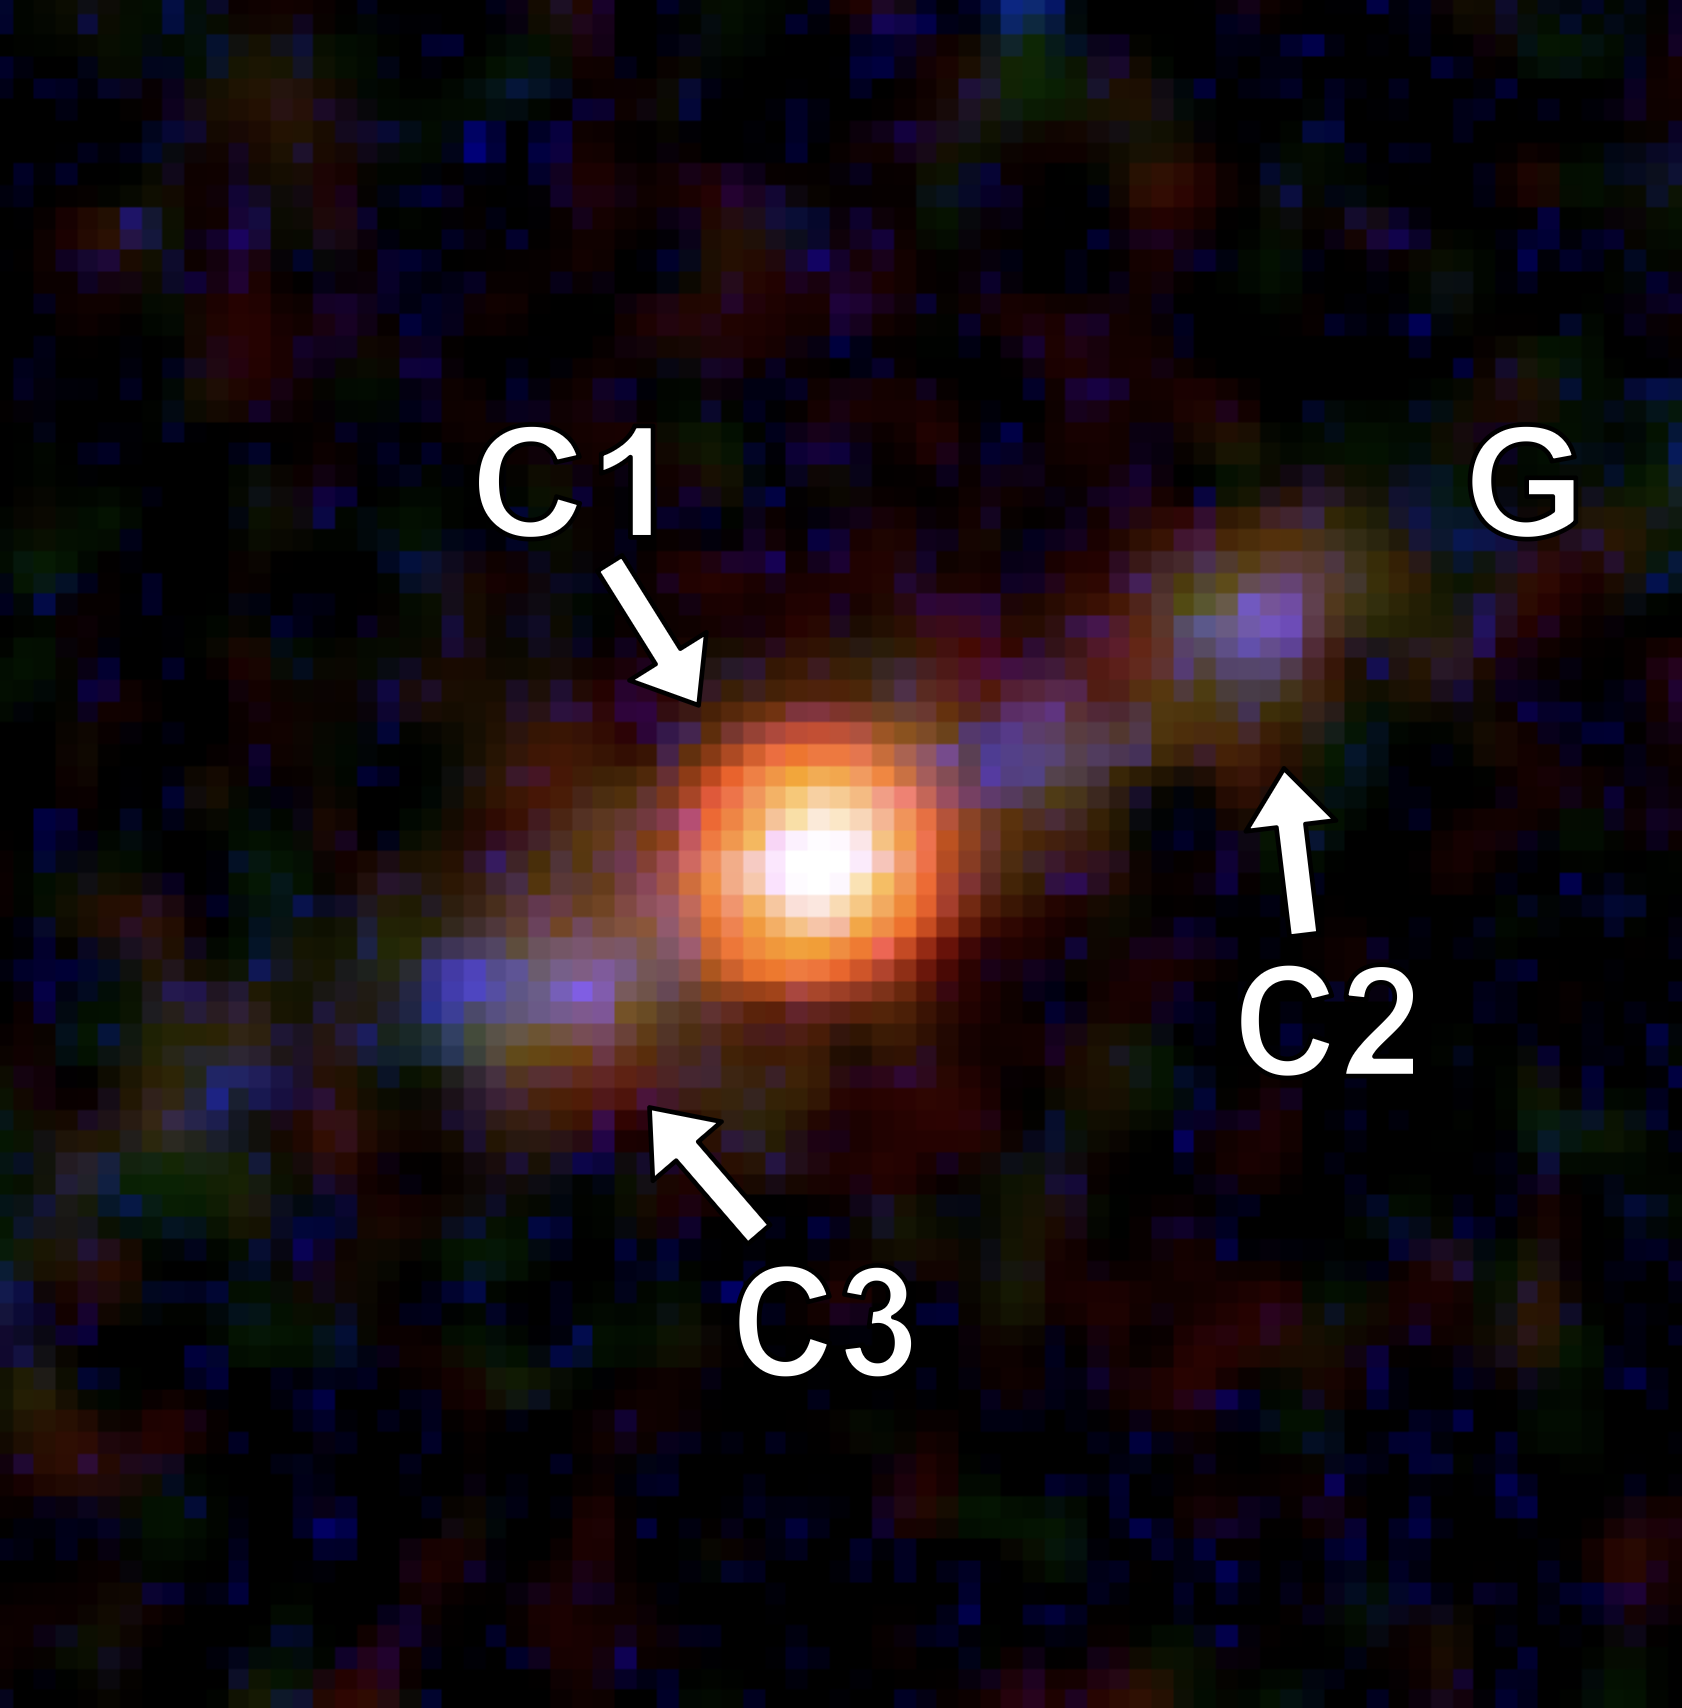
Strong lensing resolves the z=8.297 Little Red Dot “Best Friend” into a <6.8 pc central component and a low-mass host. Its V-shaped central spectrum favors, but does not establish, black-hole activity over an ultradense stellar cluster.

What changes The key advance is source-plane, component-resolved analysis of a highly magnified LRD host at ≲7 pc scales. C1 has the defining V-shaped spectrum but lies 50±10 pc from the reconstructed galaxy center; the authors caution that differential magnification could produce the apparent offset. They argue that the density required for a stellar-cluster origin makes black-hole activity the better interpretation, while retaining the cluster scenario as possible.

Figure 1 from A Supermagnified Little Red Dot with a Resolved HostFigure 1 · Open paper
Figure notes (3)
  • Figure 1. Tests whether lens modelling can deblend the lensed image into a host and three clumps. Residuals assess adequacy of the four-component forward model, while the source-plane reconstruction tests the reported ∼50 pc C1–host-center offset.
  • Figure 2. Tests the central-engine interpretation by comparing extracted total, host-subtracted C1, and host spectra. It also shows the Balmer-line model associated with the quoted BH-mass upper limit; non-detection of broad lines remains inconclusive at the available PRISM quality.
  • Figure 3. Places the object’s BH-mass upper limit and host-mass interval against JWST AGN/LRD samples and local and z∼4–7 relations. It tests possible BH-to-host-mass tension, but cannot determine that ratio without a measured BH mass.

The obscured nucleus of NGC3256 S. I. Anisotropic AGN near-IR radiation field traced by CO v=1-0 with JWST/NIRSpec

Miguel Pereira-Santaella, Eduardo González-Alfonso, Ismael García-Bernete et al.

JWST/NIRSpec CO v=1–0 emission across NGC 3256 S’s outflow base implies that the obscured AGN’s 4.7-μm radiation is anisotropic and likely collimated, though the inferred geometry depends on radiative-transfer assumptions.

What changes Rather than using CO solely to characterize gas excitation, the analysis uses line-by-line CO fluorescence fits to reconstruct the angular 4.7-μm field incident on the outflow. The mismatch between this reconstructed illumination and the observed edge-on nuclear continuum supports anisotropy. The authors further interpret blueshifted nuclear CO absorption, the outflow, and absent high-ionization lines as an expanding, high-covering-factor obscurer; this is an interpretation consistent with, but not by itself a unique proof of, AGN clearing. [paper:2611.07020v1:13c8895d88b7:26, paper:2611.07020v1:13c8895d88b7:55]

Figure notes (3)
  • Figure 1. Tests the spatial association central to the analysis: 4.7-μm continuum, H2, and CO maps are compared with the marked outflow axis, disk direction, and extraction apertures. This assesses whether CO emission is concentrated at the outflow base rather than the edge-on disk.
  • Figure 3. Tests the spectral modeling aperture by aperture: continuum-subtracted spectra and individual CO-line fluxes are compared to the best-fit Monte-Carlo model, while posterior distributions show constraints on kinetic temperature and CO column per linewidth. The inferred isotropic-core flux is also contrasted with the observed nuclear spectrum.
  • Figure 4. Tests isotropic dilution versus collimation by plotting the modeled required d²Fν against distance. Off-axis and outflow-axis regions are separated, and the isotropic line-of-sight estimate is compared with a fitted collimated-beam relation.

Co-evolution of AGN and Host Galaxies across Cosmic Time Using JWST data

Priyanka Jalan, Tomotsugu Goto, Tetsuya Hashimoto et al.

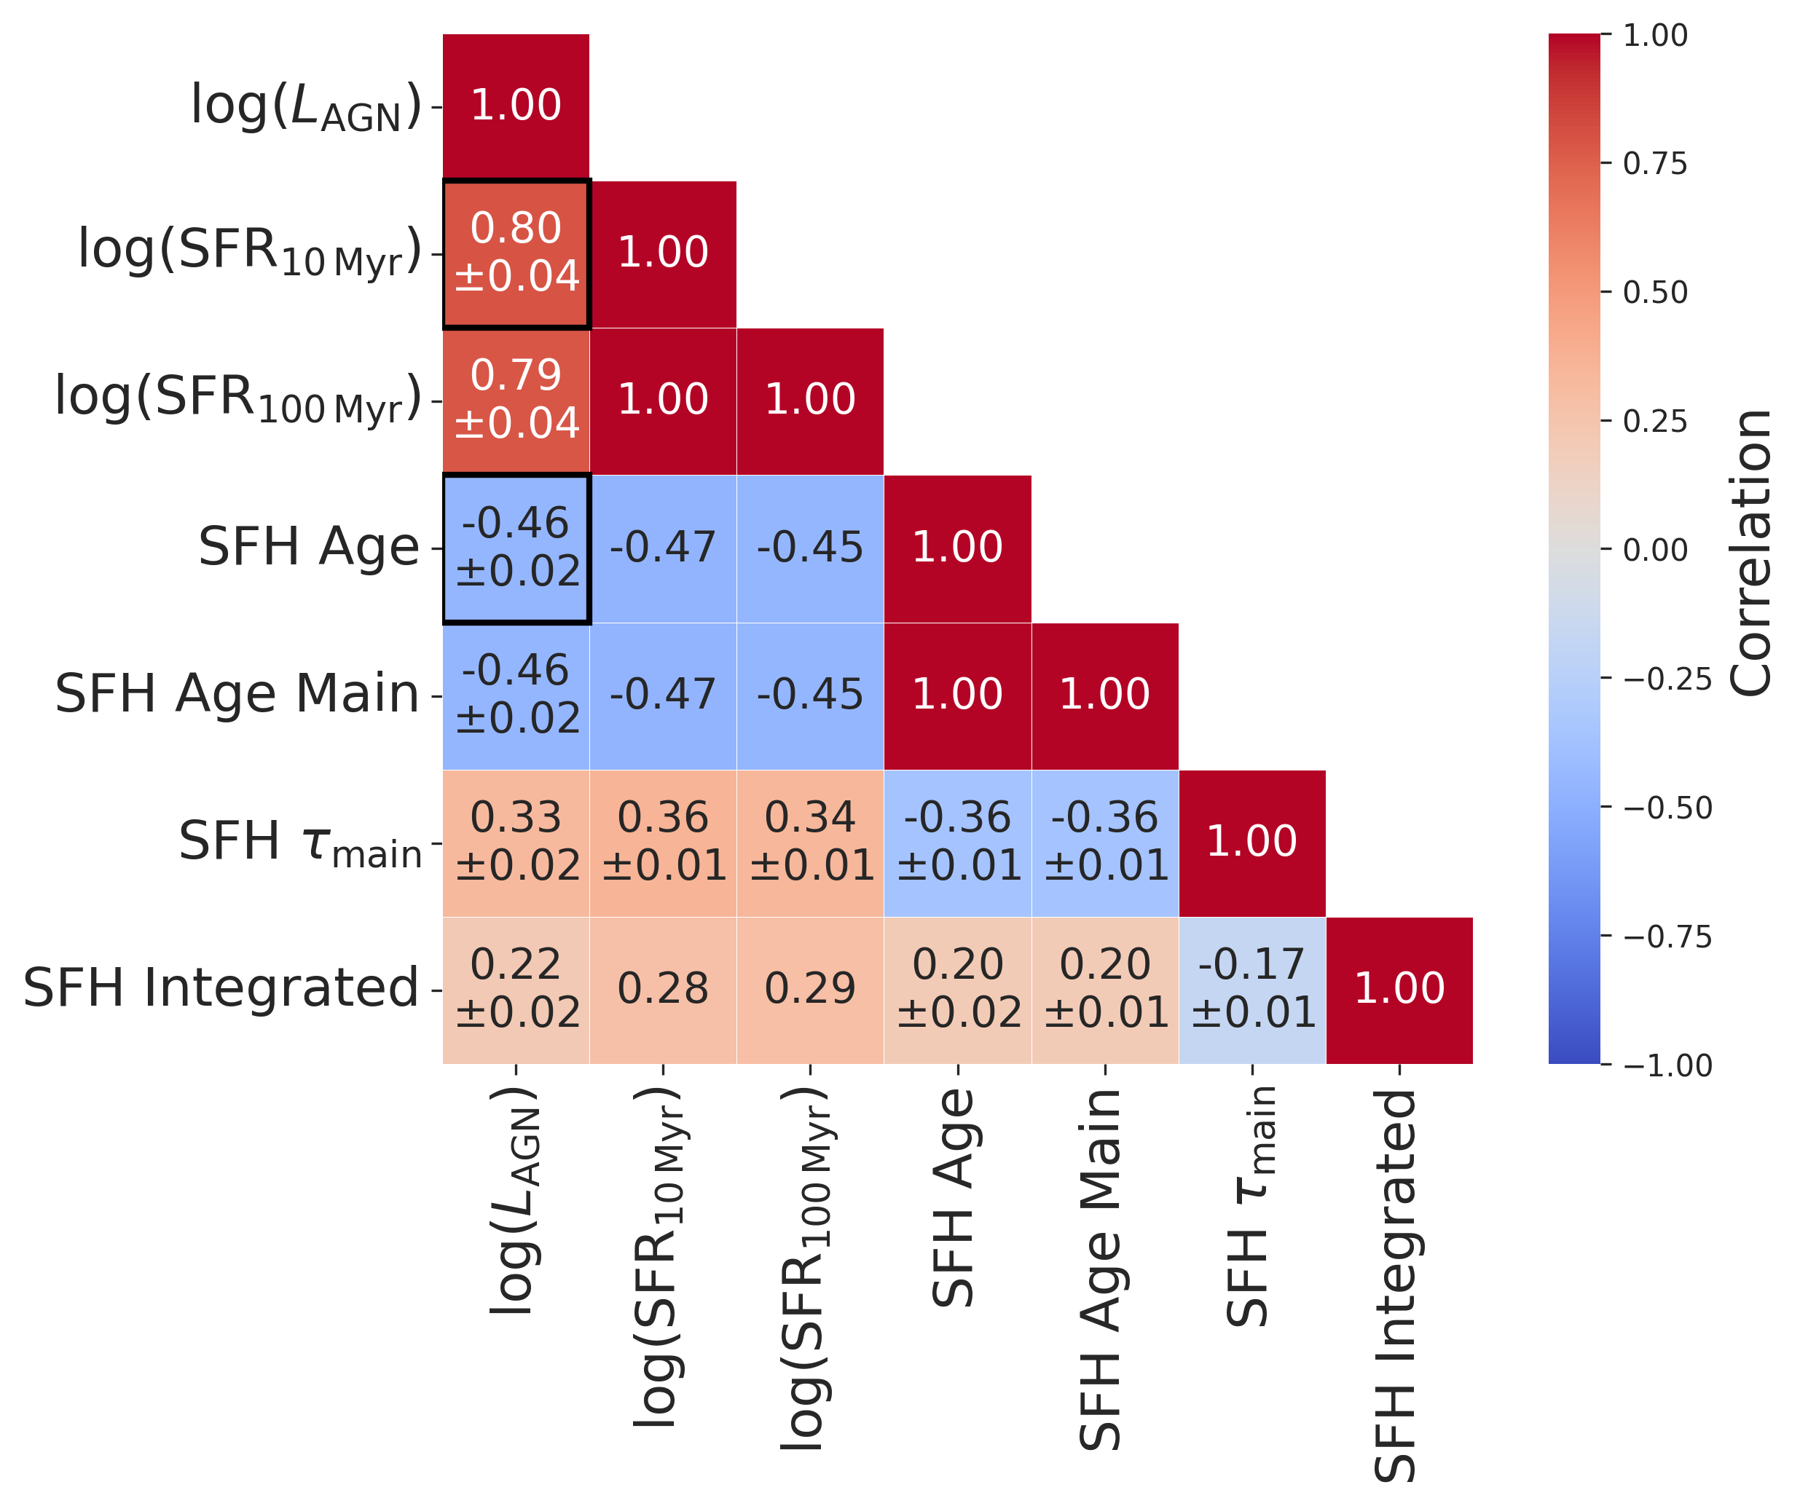
Across 2,709 SMILES–JADES sources at 0.05<z<6, AGN luminosity tracks recent star formation and dust emission more strongly than stellar mass. PCA identifies activity and age axes, but the inferred cold-gas driver is an interpretation rather than a direct gas measurement.

What changes The paper’s contribution is a joint correlation-and-PCA description across a broad redshift baseline rather than a single AGN-incidence measurement. It reports aligned PCA loadings for AGN luminosity, recent SFR, and dust luminosity at high lookback time, and a bimodal host-dominated population at late times. To test luminosity-selection sensitivity, the authors also repeat PCA in three volume-limited subsamples and state that the qualitative result is consistent. They interpret the alignment as synchronized black-hole and galaxy growth in gas-rich systems.

Figure 1 from Co-evolution of AGN and Host Galaxies across Cosmic Time Using JWST dataFigure 1 · Open paper
Figure notes (3)
  • Figure 1. Tests the pairwise correlation structure between AGN luminosity and SFH-module quantities, including SFR and SFH parameters; it is the correlation-analysis basis for selecting highlighted parameters.
  • Figure 4. Tests whether L_AGN varies with recent (10 Myr) SFR and SFH duration, separating total, host-dominated, and AGN-dominated samples and encoding redshift by colour.
  • Figure 7. Tests whether a low-dimensional PCA describes the full sample: PC1 is the activity axis and PC2 the age/evolution axis, together explaining 93% of variance according to the caption.

The HST-Hyperion Survey: X-ray AGN Enhancement in the Hyperion Proto-supercluster

Ashlen Coburn, Finn Giddings, Derek Sikorski et al.

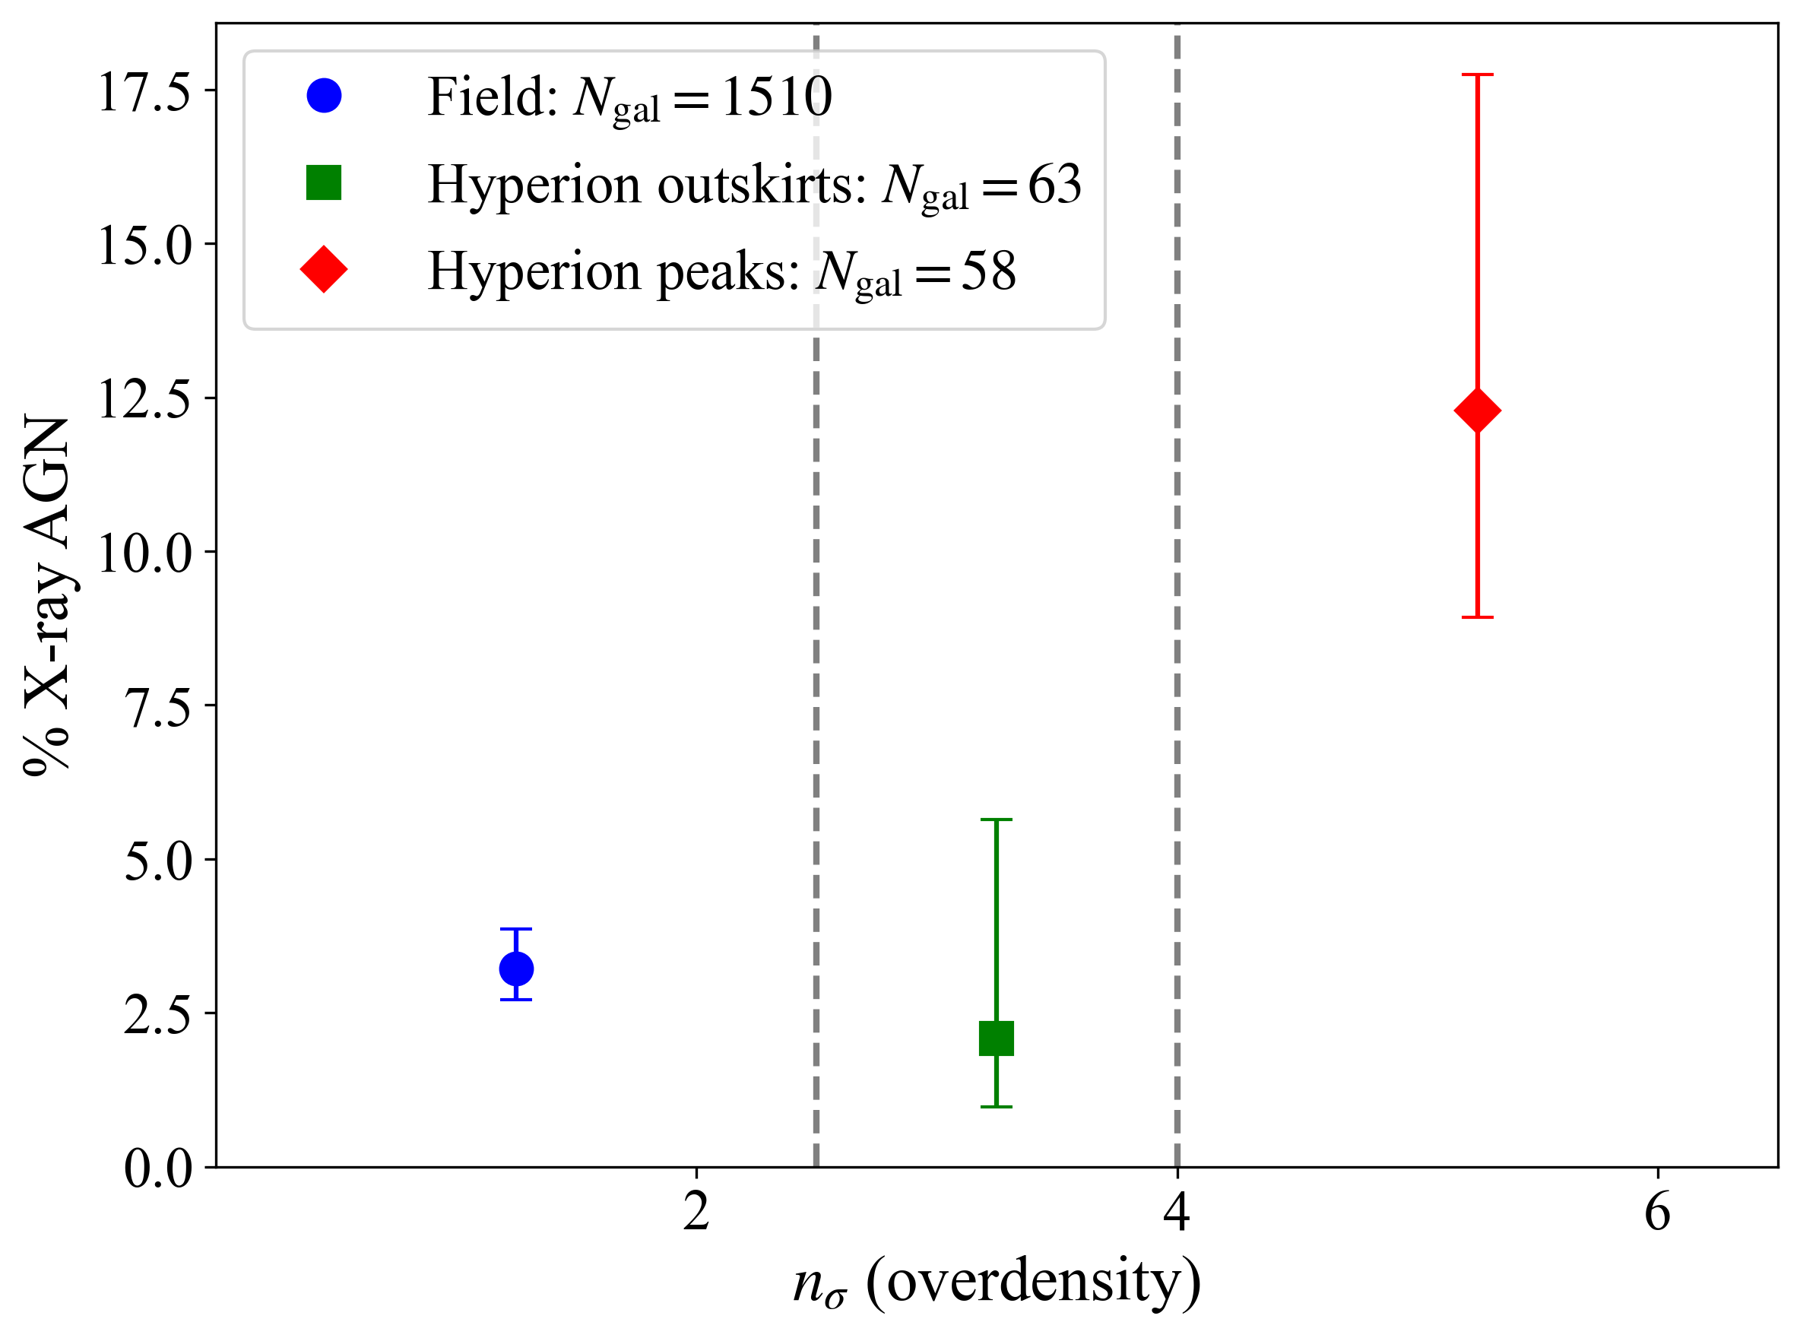
At z≈2.5, Hyperion has a higher X-ray AGN fraction than its coeval field, but the ≈2.3σ excess is confined to the densest peaks; its outskirts are statistically consistent with the field.

What changes This work resolves one proto-supercluster into local-density regimes rather than treating it as a single environment: the reported excess occurs at nσ≥4, whereas 2.5≤nσ<4 is field-like. It also tests whether host stellar mass or observed 0.5–10 keV luminosity distributions differ between Hyperion and field. Across 100 realizations, KS-test median p-values are 0.236, 0.784, and 0.364, respectively, providing no detected distributional difference.

Figure 2 from The HST-Hyperion Survey: X-ray AGN Enhancement in the Hyperion Proto-superclusterFigure 2 · Open paper
Figure notes (3)
  • Figure 2. Tests whether X-ray AGN incidence changes with local overdensity by comparing field, Hyperion outskirts, and dense peaks; its error bars combine Monte Carlo and Bayesian-binomial uncertainty.
  • Figure 3. Tests whether the peak signal tracks peak mass. The higher combined fraction in massive peaks is suggestive, but the large uncertainties do not support a mass dependence.
  • Figure 4. Tests potential confounding by comparing Hyperion and field cumulative stellar-mass, AGN-host-mass, and X-ray-luminosity distributions; the reported KS tests find no statistically significant differences.

Supermassive black holes and nuclear star clusters in galaxies: constraining formation and co-evolution with SHARP and MICADO

E. Dalla Bonta', E. Portaluri, C. Arcidiacono et al.

This SHARP and MICADO science case sets out a unified, parsec-scale program to measure supermassive-black-hole masses, nuclear-star-cluster kinematics and populations, nuclear structure, and gas-inflow signatures in nearby galaxy nuclei. The central aim is to distinguish in-situ cluster growth, star-cluster infall, and black-hole-driven cusp formation, while mapping the transition from low-mass nuclei where clusters can regulate gas supply and black-hole growth to massive core galaxies shaped by mergers and black-hole binaries. Its key practical result is to define the black-hole-mass and distance regimes in which ELT/SHARP can resolve the sphere of influence and nuclear-cluster scales beyond JWST/NIRSpec capabilities. Nearby systems are explicitly presented as a local physics laboratory rather than direct evolutionary analogues of compact active nuclei at high redshift.

Figure notes (1)
  • Figure 1. This feasibility diagram directly establishes the observational reach of the proposed program by comparing black-hole sphere-of-influence and nuclear-star-cluster angular scales with SHARP and JWST/NIRSpec sampling. It shows which black-hole masses, cluster sizes, and galaxy distances permit resolved nuclear dynamics, making it the quantitative bridge between the formation questions and the claimed ELT capability.

A Composite Rest-Frame UV Spectrum of Galaxies at $5.7 < z < 6.9$: Ionization, Outflows, and Implications for Intergalactic Metal Enrichment

David DePalma, Robert A. Simcoe, Anna-Christina Eilers et al.

A 104-galaxy JWST composite at mean z=6.50 finds ≈180–200 km s⁻¹ blueshifted interstellar absorption. A simple wind-propagation model places most material only 3–9 proper kpc away, challenging bright [O III]-selected galaxies as the dominant source of widespread intergalactic metals.

What changes This work joins a population-average rest-UV outflow measurement to a trajectory calculation for the same bright [O III]-selected population. For a nominal 200 km s⁻¹ wind and typical 38 Myr integration time, most modeled winds reach 3–9 proper kpc; some are gravitationally bound and turn around. The authors further estimate that ≈5 kpc bubbles contribute under 1% of the observed quasar-sightline absorber incidence, motivating a proposed contribution from numerous undetected 10^5–10^6 M⊙ galaxies near detected systems.

Figure notes (3)
  • Figure 1. Tests whether the stacked spectral morphology is robust to reduction pipeline: PypeIt and MSAExp stacks are contrasted, and the MSAExp composite is compared with a z=3 Lyman-break-galaxy stack. The caption flags redward features in PypeIt near ≈1850 Å as spurious edge effects.
  • Figure 4. Tests the velocity reference frame and outflow inference by showing emission- and absorption-line centroids. O III] and C III] cross-check the systemic frame, whereas the ensemble of usable absorption lines is blueshifted by roughly 180–200 km s⁻¹; unreliable N V is omitted.
  • Figure 6. Tests the distance consequences of the adopted wind model through the distribution of maximum propagation distances. Most modeled systems lie at 3–9 kpc, while the caption notes that four long-distance cases are omitted from the plotted histogram for compactness.

Introducing Aurora: A New Black Hole Seeding Model With Explicit Environmental Coupling

Harry George Chittenden, Darren Croton, Karl Glazebrook et al.

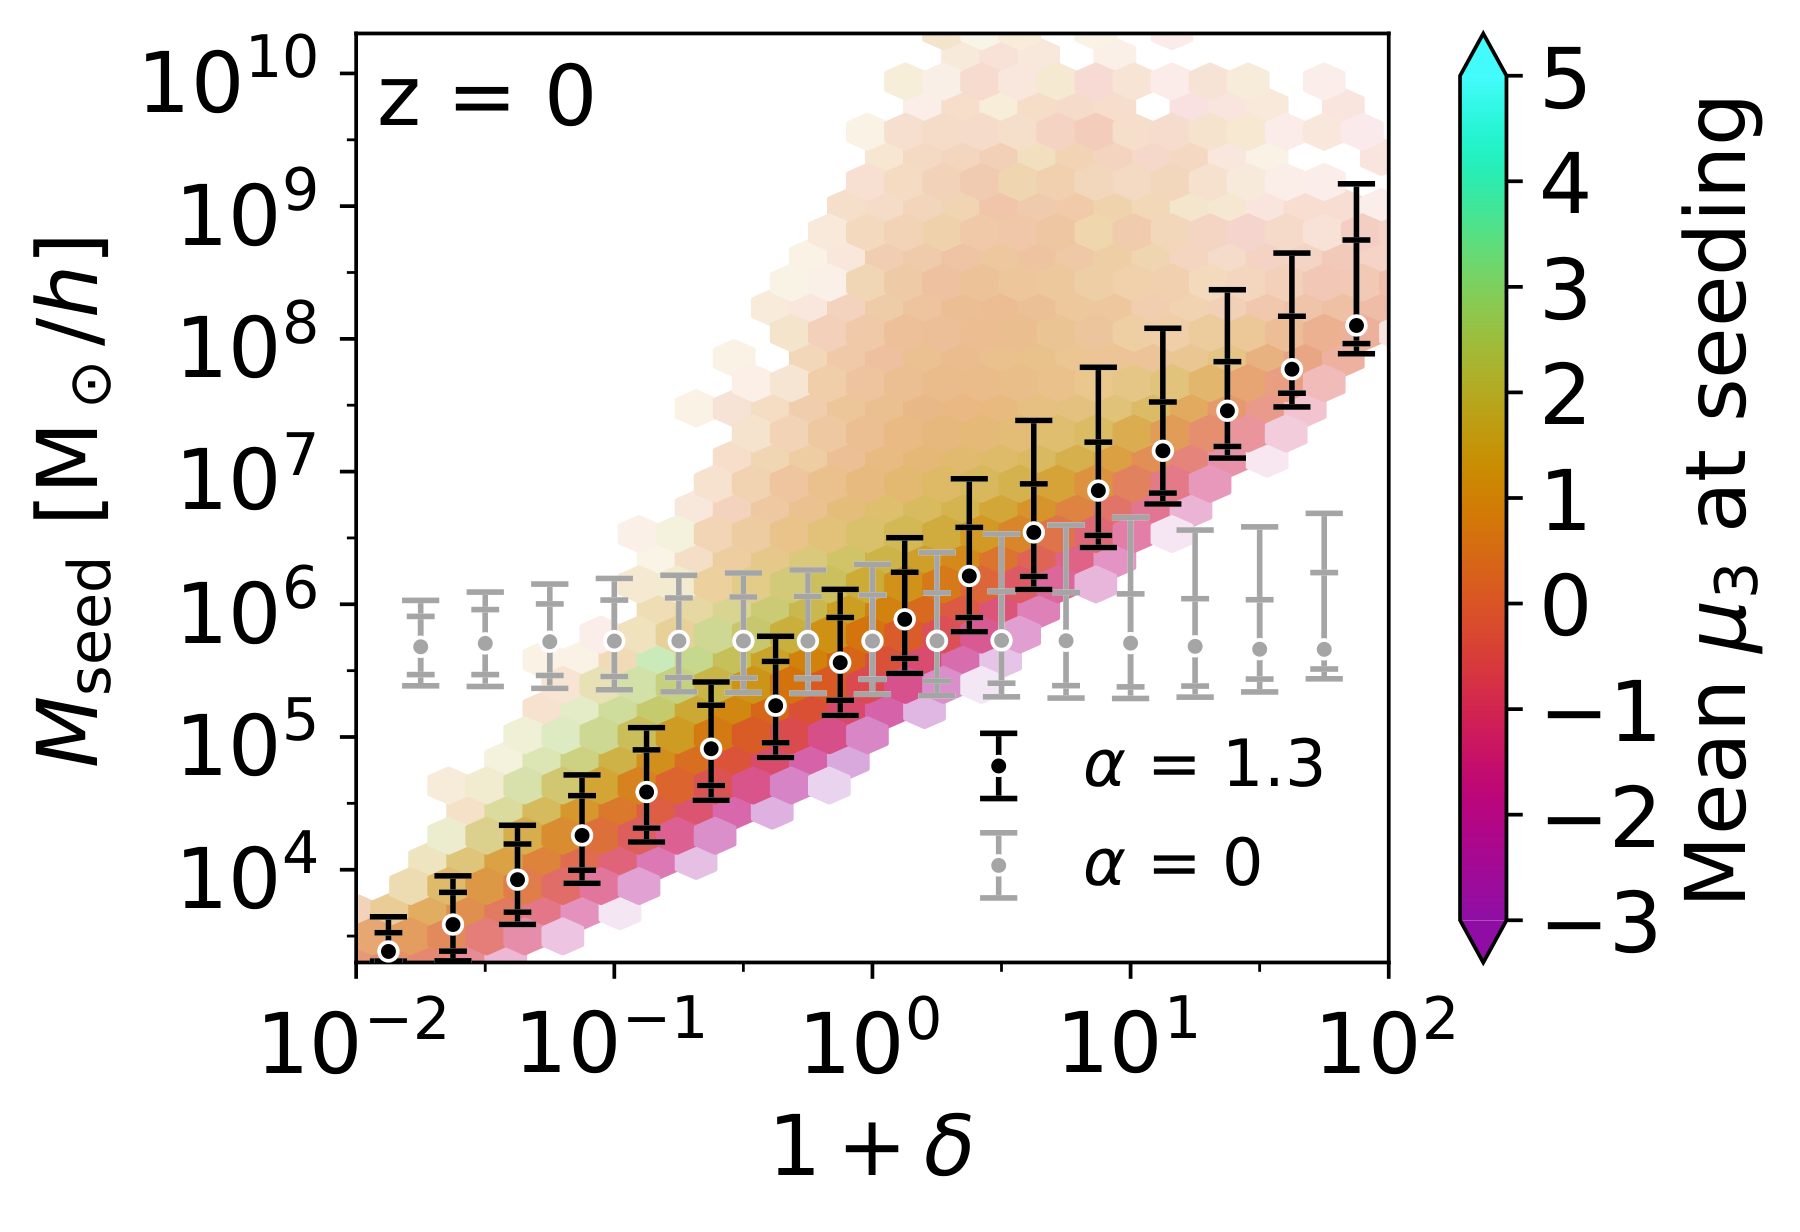
Aurora assigns black-hole seed masses continuously from halo overdensity, radial skewness, and seeding mass. In Millennium/Sage merger trees, this produces an environment-linked minority of seed-dominated massive centrals and enhances predicted quiescence in dense massive haloes near z≈3.1.

What changes The distinguishing result is not merely a broad seed spectrum but a testable environmental partition: at z≈3.1, the authors find seeded galaxies in massive haloes have quiescent-fraction enhancement Θ=+0.28 at the strongest quoted overdensity coupling, while the overdensity-tercile contrast rises from ΔΘ=+0.13 in the calibrated model to +0.36. Scrambling environments while preserving the mass spectrum removes the high-redshift gradient, supporting the model-internal attribution to environmental assignment rather than the spectrum alone. At z=4.179, Aurora changes the median log(MBH/M*) by only +0.05 dex for M*>10^9 M⊙ but raises the fraction above 10^-2 from 1.9% to 3.7%, extending the high-ratio tail rather than broadly shifting the population.

Figure 1 from Introducing Aurora: A New Black Hole Seeding Model With Explicit Environmental CouplingFigure 1 · Open paper
Figure notes (3)
  • Figure 1. Tests whether the constructed seed spectrum actually follows environmental inputs: pooled seeding events show increasing seed mass with overdensity, with radial skewness modulating the relation. The α=0 comparison tests that this trend is imposed by the coupling rather than inherited from host-halo properties.
  • Figure 7. Tests the high-redshift observational consequence in the MBH–M* plane at z=4.179. It contrasts Aurora and stock Sage medians and upper tails against JADES and Harikane broad-line AGN, showing that Aurora chiefly extends the high-MBH/M* tail.
  • Figure 9. Tests causal dependence on assigned environment by splitting seeded galaxies into overdensity terciles and rerunning with scrambled seeding environments. The reported response is concentrated in the dense tercile and largely disappears after scrambling.

Beyond Point Photo-$z$ Estimates: Normalizing Flows for Tomographic $N(z)$ Reconstruction with DESI DR1

Zhuo Chen, Antoine Rocher, Kwan Chuen Chan et al.

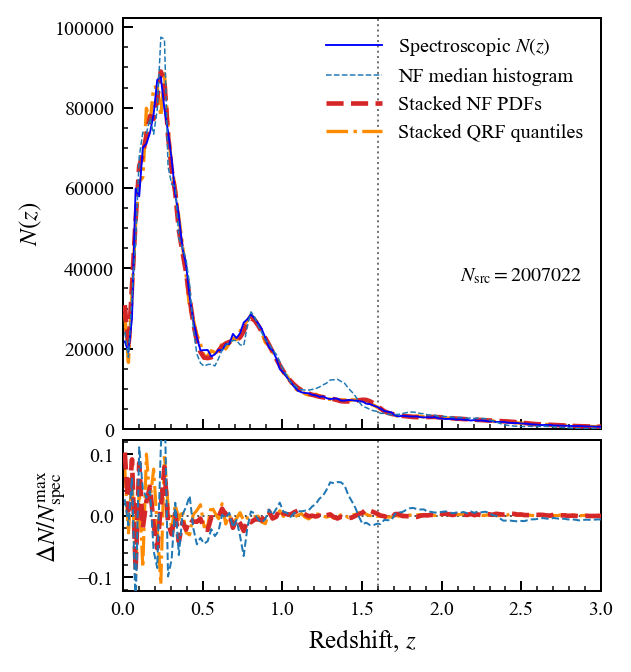
On a spatially independent DESI DR1 test set, conditional normalizing-flow redshift PDFs generally reconstruct tomographic N(z) better than quantile random forests, especially at high redshift; calibration improves several low-z mean-redshift biases but leaves population-transfer and residual-calibration limitations.

What changes The central extension is evaluation at the distribution level rather than only ranking point estimates: stacking continuous NF PDFs is tested in eight tomographic selections and against QRF stacking. The authors additionally derive redshift-dependent empirical-CDF recalibration mappings from a held-out validation region. After transfer to the independent test region, bins with 0.2<z_median<1 have absolute mean-redshift biases of 0.0016–0.0019, below the cited 0.002(1+z) Euclid benchmark in central value.

Figure 3 from Beyond Point Photo-$z$ Estimates: Normalizing Flows for Tomographic $N(z)$ Reconstruction with DESI DR1Figure 3 · Open paper
Figure notes (3)
  • Figure 3. Tests whether stacking NF or QRF PDFs recovers the full spectroscopic N(z), rather than merely producing useful posterior-median point estimates; residuals are normalized by the peak of the reference distribution.
  • Figure 7. Tests transferability of validation-derived PDF recalibration: PIT histograms are compared before and after calibration in both validation and spatially independent testing samples.
  • Figure 9. Tests tomographic mean-redshift accuracy before and after calibration across eight posterior-median bins. Points average independent NF realisations and error bars show their sample standard deviations against the Euclid benchmark.