2611.07047v1 · First listed 2026-11-06
The HST-Hyperion Survey: X-ray AGN Enhancement in the Hyperion Proto-supercluster
At z≈2.5, Hyperion has a higher X-ray AGN fraction than its coeval field, but the ≈2.3σ excess is confined to the densest peaks; its outskirts are statistically consistent with the field. [1][2][3]
Evidence
The authors identify X-ray AGN with Chandra COSMOS-Legacy and combine COSMOS2020 optical/NIR photometry and photometric redshifts with ground-based spectroscopy and HST grism data. Monte Carlo redshift realizations statistically propagate membership uncertainty. The full Hyperion sample has an AGN fraction of 7.4% (+3.2/−1.8), versus 3.2% (+0.6/−0.5) in the coeval field: a factor 2.3 (+1.1/−0.7), or ≈2.3σ. Dense peaks reach 12.3% (+5.5/−3.4), 2.6σ above the field; outskirts yield 2.1% (+3.6/−1.1). Fraction errors combine Monte Carlo variation with Bayesian binomial intervals. [1][2][3][6][7]
Earlier work
A supplied comparison at substantially earlier cosmic time found no individual X-ray detections among 21 spectroscopically confirmed galaxies in a z=6.63 protocluster and a stacked luminosity upper limit. Thus, it contrasts with Hyperion’s detected peak enhancement, but differences in redshift, structure, selection, and sensitivity preclude an evolutionary inference. [12][3]
What changes
This work resolves one proto-supercluster into local-density regimes rather than treating it as a single environment: the reported excess occurs at nσ≥4, whereas 2.5≤nσ<4 is field-like. It also tests whether host stellar mass or observed 0.5–10 keV luminosity distributions differ between Hyperion and field. Across 100 realizations, KS-test median p-values are 0.236, 0.784, and 0.364, respectively, providing no detected distributional difference. [7][8][9]
Limits and open questions
The result measures X-ray-selected AGN incidence, not all accretion, so it does not establish a physical triggering mechanism. Small AGN numbers limit the mass and luminosity comparison tests. Peak-level fractions are highly uncertain: Peak 2 is 33.3% (+17.9/−11.8), and the lower-mass peak group is 6.2% (+11.9/−2.1); hence the authors cannot determine a dependence on peak mass. Individual peak masses also carry ≈0.25 dex uncertainty. [4][5][8]
Evidence includes the target paper’s abstract and extracted Results/Discussion blocks plus figure captions; detailed parent-sample selection, flux/luminosity thresholds, and full sample counts were not supplied in the extraction.
Key figures
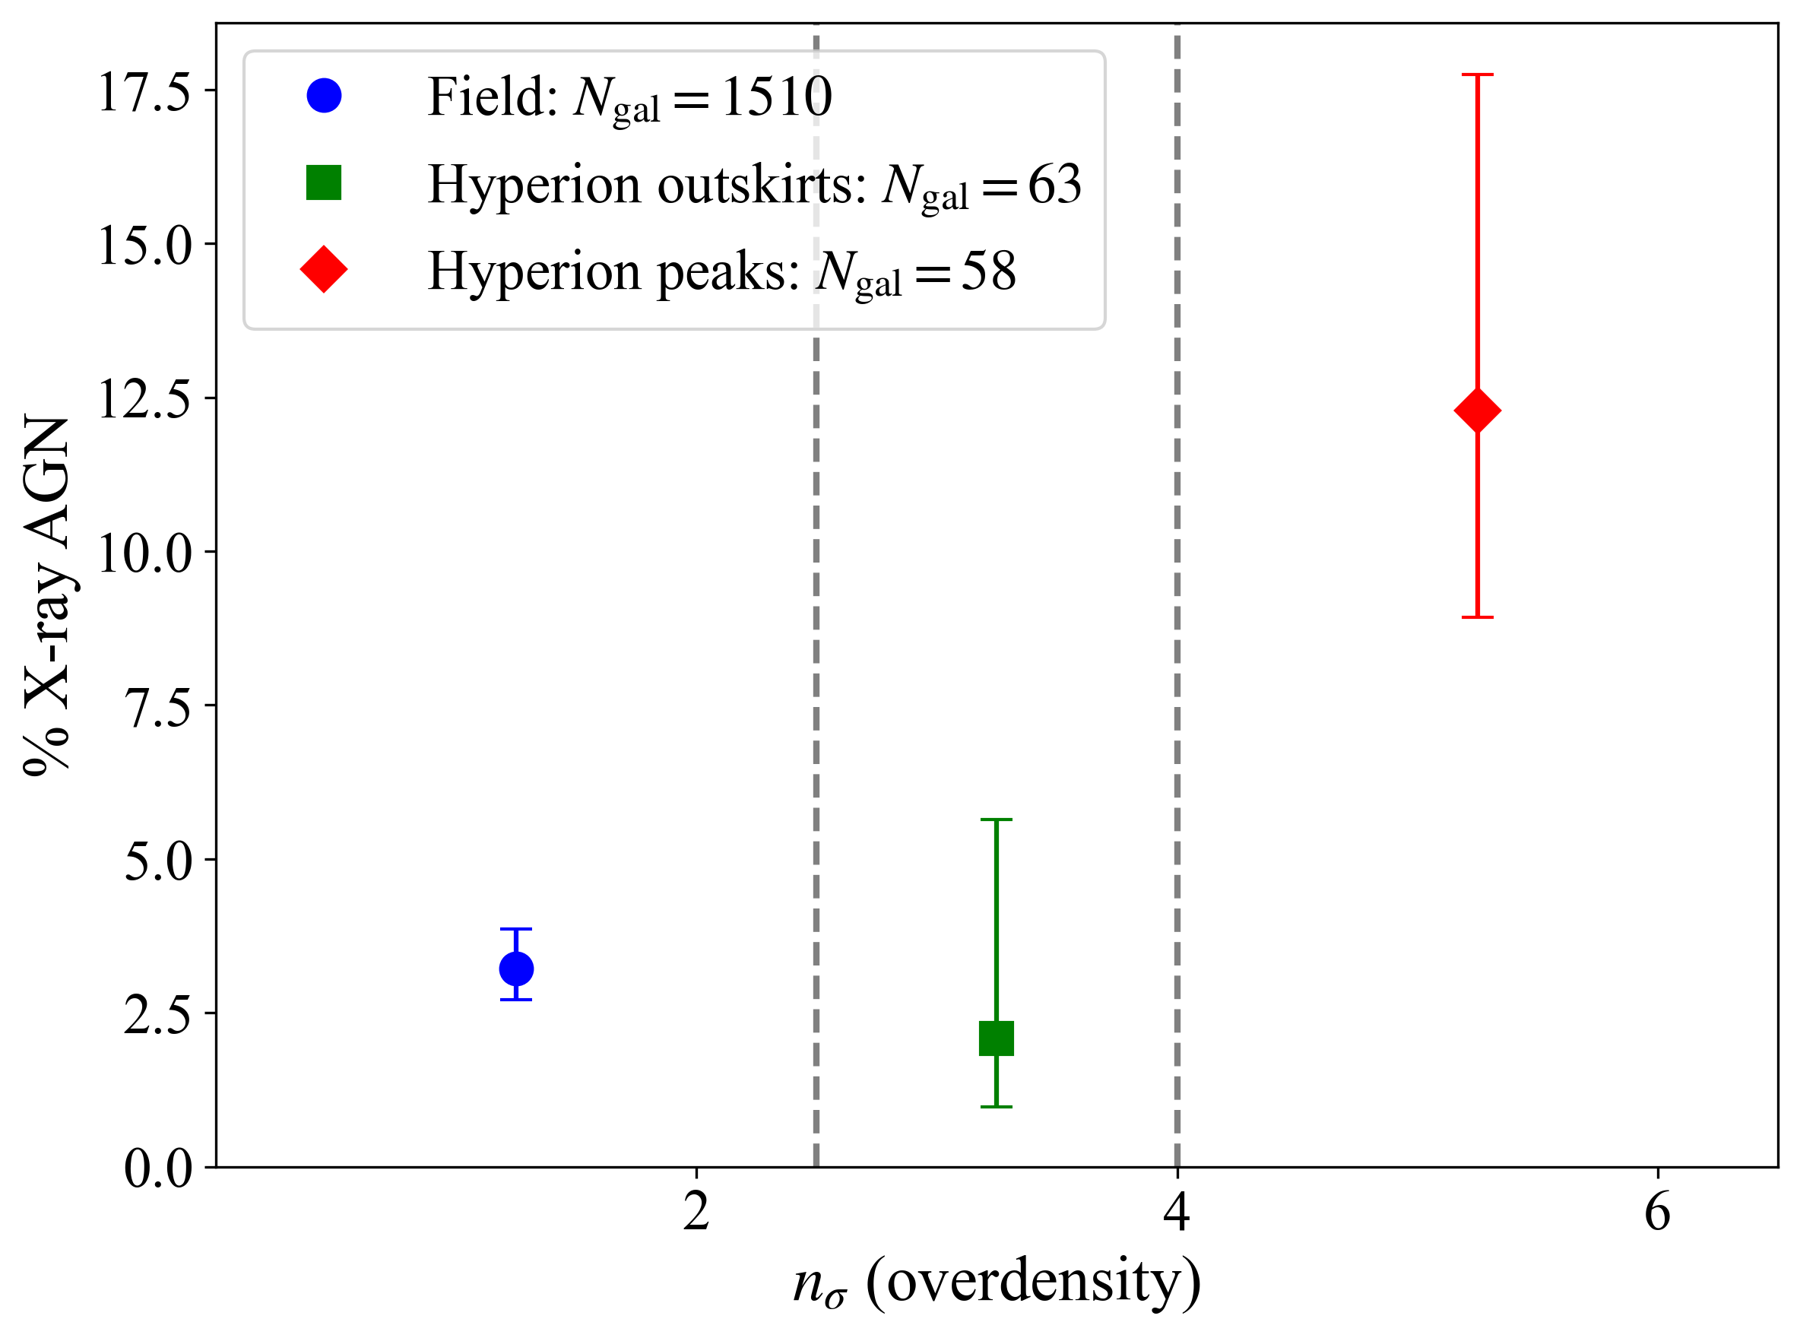
Tests whether X-ray AGN incidence changes with local overdensity by comparing field, Hyperion outskirts, and dense peaks; its error bars combine Monte Carlo and Bayesian-binomial uncertainty.
Original caption
Figure 2: X-ray AGN fraction (in %) as a function of local overdensity in the Hyperion proto-supercluster and coeval field. The galaxy population is divided into three environments: the coeval field (blue), the Hyperion outskirts ( 2.5 ≤ n σ < 4 2.5\leq n_{\sigma}<4 ; green), and the dense Hyperion peaks ( n σ ≥ 4 n_{\sigma}\geq 4 ; red). Error bars represent the total uncertainties on the AGN fractions, combining the Monte Carlo realizations and Bayesian binomial confidence intervals. The highest X-ray AGN fraction is observed in the dense Hyperion peaks, while the outskirts are consistent with the coeval field within the uncertainties.

Tests whether the peak signal tracks peak mass. The higher combined fraction in massive peaks is suggestive, but the large uncertainties do not support a mass dependence.
Original caption
Figure 3: X-ray AGN fraction as a function of peak mass for the Hyperion density peaks. Individual points are shown for the four peaks that host X-ray AGN (Peaks 1, 2, 3, and 6). We find X-ray AGN fractions of 10.5 − 3.6 + 11.1 % 10.5^{+11.1}_{-3.6}\% ( 2.0 / 18.7 2.0/18.7 ) in Peak 1, 33.3 − 11.8 + 17.9 % 33.3^{+17.9}_{-11.8}\% ( 3.0 / 8.9 3.0/8.9 ) in Peak 2, 7.7 − 2.6 + 14.0 % 7.7^{+14.0}_{-2.6}\% ( 1.1 / 13.4 1.1/13.4 ) in Peak 3, and 14.3 − 6.1 + 21.5 % 14.3^{+21.5}_{-6.1}\% ( 1.0 / 7.2 1.0/7.2 ) in Peak 6. The values in parentheses give the mean N AGN / N gal N_{\rm AGN}/N_{\rm gal} across the Monte Carlo realizations. Peak masses are taken from Sikorski et al. [59] . The size of each point scales with the mean number of total galaxies identified in that peak or peak-mass group across the Monte Carlo realizations. The more massive peaks are Peaks 1–3 with M peak = 0.88 M_{\rm peak}=0.88 – 2.02 × 10 14 M ⊙ 2.02\times 10^{14}\,\mathrm{M_{\odot}} , while the less massive peaks are Peaks 4–7 with M peak = 0.13 M_{\rm peak}=0.13 – 0.48 × 10 14 M ⊙ 0.48\times 10^{14}\,\mathrm{M_{\odot}} . For the two mass groups, the AGN fraction is calculated from the total number of X-ray AGN and galaxies across the included peaks in each Monte Carlo realization, and the point is placed at the mean peak mass of the group. The uncertainty in the mass of each peak is ∼ 0.25 \sim 0.25 dex [ 60 ] . The dashed line and shaded region show the coeval field AGN fraction and its uncertainty.
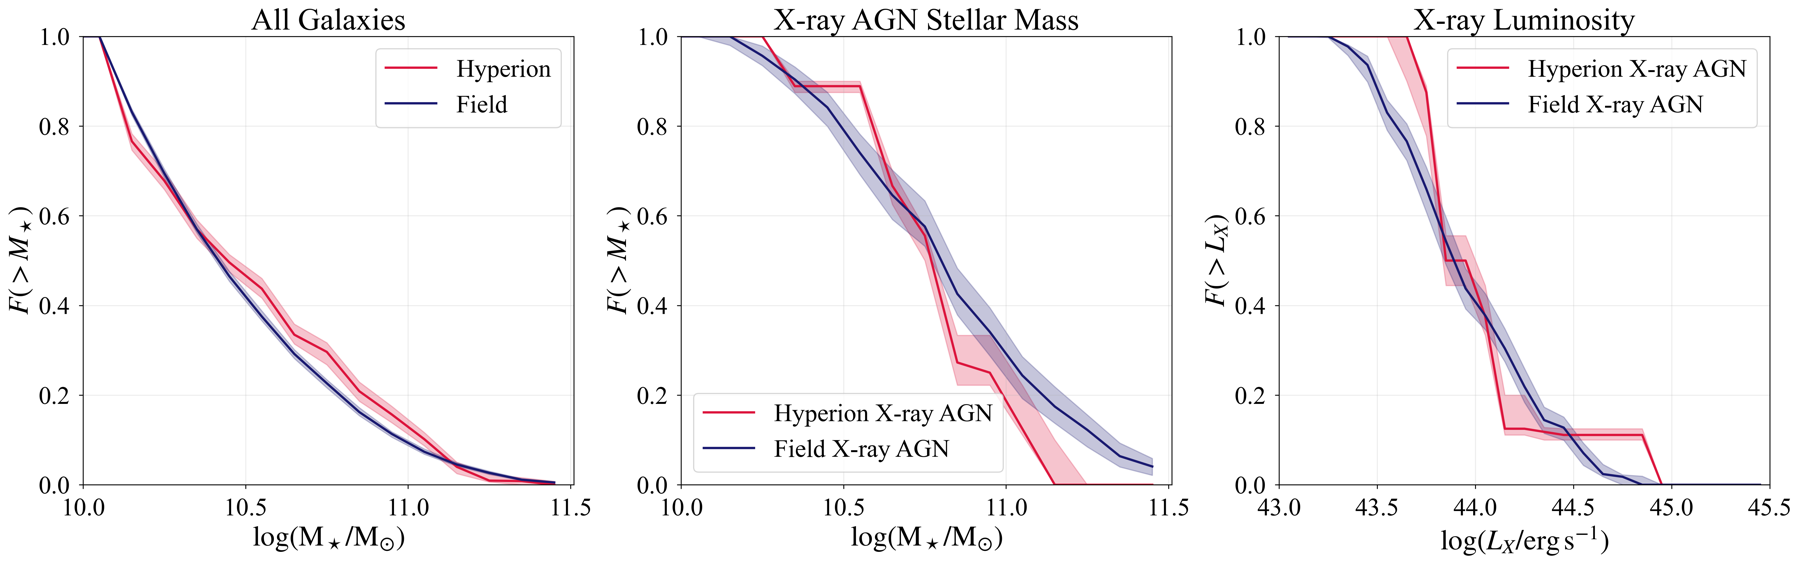
Tests potential confounding by comparing Hyperion and field cumulative stellar-mass, AGN-host-mass, and X-ray-luminosity distributions; the reported KS tests find no statistically significant differences.
Original caption
Figure 4: Cumulative distributions of stellar mass (left), X-ray AGN host stellar mass (middle), and full-band ( 0.5 − 10 0.5-10 keV) X-ray luminosity (right) for the Hyperion and coeval field samples. Two-sample KS tests across the 100 Monte Carlo realizations give median p p -values of 0.236 0.236 , 0.784 0.784 , and 0.364 0.364 , respectively. We find no statistically significant differences between the Hyperion and coeval field distributions in any of the three comparisons.
Related research
Previous digest
Coburn et al. measure the X-ray-selected AGN fraction across the z≈2.5 Hyperion proto-supercluster using Chandra COSMOS-Legacy detections, COSMOS2020 photometry, extensive spectroscopy and HST grism redshifts, with redshift uncertainties propagated through Monte Carlo realizations. Above a common stellar-mass selection, Hyperion has an AGN fraction of 7.4% versus 3.2% in the coeval field, a ≈2.3σ excess. The signal is concentrated in Hyperion’s dense peaks, where the fraction rises to 12.3% and reaches 15.0% in the most massive peaks, while the lower-density outskirts are consistent with the field. The result supports a picture in which the interaction-rich, assembling cores of massive protostructures preferentially trigger black-hole accretion at cosmic noon.
Sources and evidence (25)
- 2611.07047v1: The HST-Hyperion Survey: X-ray AGN Enhancement in the Hyperion Proto-supercluster
Dense environments can influence both galaxy evolution and supermassive black hole growth, but whether they enhance or suppress (or both) active galactic nuclei (AGN) activity at high redshift ($z\gtrsim2$) remains uncertain. As one of the most massive structures identified in the early universe, the Hyperion proto-supercluster at $z\approx2.5$ provides a unique opportunity to investigate this connection during an epoch near the peak of both cosmic star formation rate and AGN activity density. To examine the impact of galaxy environment on AGN activity, we measure the fraction of X-ray-selected AGN in Hyperion as a whole, its highly overdense peaks, and its outskirts, comparing these measurements to a coeval field sample. We identify X-ray AGN using the deep Chandra COSMOS-Legacy Survey and combine optical/near-infrared (NIR) photometry and photometric redshift information from COSMOS2020 with extensive ground-based spectroscopy and HST-grism observations. Redshift information is incorporated statistically using a Monte Carlo framework. We find a higher X-ray AGN fraction in Hyperion ($7.4^{+3.2}_{-1.8}\%$) than in the coeval field ($3.2^{+0.6}_{-0.5}\%$), corresponding to a $\sim2.3σ$ difference. Strikingly, this enhancement is concentrated in the overdense peaks, where the X-ray AGN fraction reaches $12.3^{+5.5}_{-3.4}\%$ ($15.0^{+6.9}_{-4.4}\%$ in the most massive peaks versus $6.2^{+11.9}_{-2.1}\%$ in the less massive peaks), while the lower-density Hyperion outskirts ($2.1^{+3.6}_{-1.1}\%$) show no evidence of enhancement relative to the field. These results add to the limited but growing evidence for enhanced AGN activity in high-redshift protostructures, suggesting that the dense environments at these epochs may preferentially trigger AGN during the early stages of cluster assembly.
- 2611.07047v1: The HST-Hyperion Survey: X-ray AGN Enhancement in the Hyperion Proto-supercluster
The X-ray AGN fractions measured for each environment are presented in Figure 2 and summarized in Table 1 . The coeval field has an X-ray AGN fraction of 3.2 − 0.5 + 0.6 % 3.2^{+0.6}_{-0.5}\% . In contrast, the full Hyperion sample has an AGN fraction of 7.4 − 1.8 + 3.2 % 7.4^{+3.2}_{-1.8}\% , a factor of 2.3 − 0.7 + 1.1 2.3^{+1.1}_{-0.7} higher than the field.
- 2611.07047v1: The HST-Hyperion Survey: X-ray AGN Enhancement in the Hyperion Proto-supercluster
Notably, the enhanced AGN activity is not distributed uniformly throughout Hyperion. Galaxies in the outskirts have an AGN fraction of 2.1 − 1.1 + 3.6 % 2.1^{+3.6}_{-1.1}\% , consistent with the coeval field. In contrast, galaxies located in the dense Hyperion peaks have an AGN fraction of 12.3 − 3.4 + 5.5 % 12.3^{+5.5}_{-3.4}\% , a factor of 3.8 − 1.3 + 1.8 3.8^{+1.8}_{-1.3} higher than the field and a 2.6 σ 2.6\sigma difference. These results suggest that the enhanced AGN activity is concentrated in the highest-density regions of the protostructure rather than uniformly throughout Hyperion.
- 2611.07047v1: The HST-Hyperion Survey: X-ray AGN Enhancement in the Hyperion Proto-supercluster
To investigate which Hyperion peaks contribute to the enhanced AGN activity and whether the AGN fraction varies with peak mass, we compare the individual peaks hosting X-ray AGN and the combined more massive and less massive peak populations in Figure 3 , using the peak assignments and masses of Sikorski et al. [59] . In the individual peak comparison, we find that Peak 2 has the highest AGN fraction at 33.3 − 11.8 + 17.9 % 33.3^{+17.9}_{-11.8}\% , while Peaks 1, 3, and 6 have AGN fractions of 10.5 − 3.6 + 11.1 % 10.5^{+11.1}_{-3.6}\% , 7.7 − 2.6 + 14.0 % 7.7^{+14.0}_{-2.6}\% , and 14.3 − 6.1 + 21.5 % 14.3^{+21.5}_{-6.1}\% , respectively. When grouped by peak mass, the three most massive peaks (Peaks 1–3) have a combined AGN fraction of 15.0 − 4.4 + 6.9 % 15.0^{+6.9}_{-4.4}\% , compared with 6.2 − 2.1 + 11.9 % 6.2^{+11.9}_{-2.1}\% for the less massive peaks (Peaks 4–7). Although the measured AGN fraction is higher in the more massive peaks, the large uncertainties, particularly among the less massive peaks, limit our ability to determine whether the X-ray AGN fraction depends on peak mass.
- 2611.07047v1: The HST-Hyperion Survey: X-ray AGN Enhancement in the Hyperion Proto-supercluster
Figure 3: X-ray AGN fraction as a function of peak mass for the Hyperion density peaks. Individual points are shown for the four peaks that host X-ray AGN (Peaks 1, 2, 3, and 6). We find X-ray AGN fractions of 10.5 − 3.6 + 11.1 % 10.5^{+11.1}_{-3.6}\% ( 2.0 / 18.7 2.0/18.7 ) in Peak 1, 33.3 − 11.8 + 17.9 % 33.3^{+17.9}_{-11.8}\% ( 3.0 / 8.9 3.0/8.9 ) in Peak 2, 7.7 − 2.6 + 14.0 % 7.7^{+14.0}_{-2.6}\% ( 1.1 / 13.4 1.1/13.4 ) in Peak 3, and 14.3 − 6.1 + 21.5 % 14.3^{+21.5}_{-6.1}\% ( 1.0 / 7.2 1.0/7.2 ) in Peak 6. The values in parentheses give the mean N AGN / N gal N_{\rm AGN}/N_{\rm gal} across the Monte Carlo realizations. Peak masses are taken from Sikorski et al. [59] . The size of each point scales with the mean number of total galaxies identified in that peak or peak-mass group across the Monte Carlo realizations. The more massive peaks are Peaks 1–3 with M peak = 0.88 M_{\rm peak}=0.88 – 2.02 × 10 14 M ⊙ 2.02\times 10^{14}\,\mathrm{M_{\odot}} , while the less massive peaks are Peaks 4–7 with M peak = 0.13 M_{\rm peak}=0.13 – 0.48 × 10 14 M ⊙ 0.48\times 10^{14}\,\mathrm{M_{\odot}} . For the two mass groups, the AGN fraction is calculated from the total number of X-ray AGN and galaxies across the included peaks in each Monte Carlo realization, and the point is placed at the mean peak mass of the group. The uncertainty in the mass of each peak is ∼ 0.25 \sim 0.25 dex [ 60 ] . The dashed line and shaded region show the coeval field AGN fraction and its uncertainty.
- 2611.07047v1: The HST-Hyperion Survey: X-ray AGN Enhancement in the Hyperion Proto-supercluster
Table 1: X-ray AGN fractions across the Hyperion environments and coeval field. Galaxy and X-ray AGN counts represent the median values across the Monte Carlo realizations, with uncertainties combining the 16th and 84th percentile MC variations and Poisson counting uncertainties in quadrature. AGN fraction uncertainties combine MC variations and binomial uncertainties following Cameron [8] in quadrature.
- 2611.07047v1: The HST-Hyperion Survey: X-ray AGN Enhancement in the Hyperion Proto-supercluster
Figure 2: X-ray AGN fraction (in %) as a function of local overdensity in the Hyperion proto-supercluster and coeval field. The galaxy population is divided into three environments: the coeval field (blue), the Hyperion outskirts ( 2.5 ≤ n σ < 4 2.5\leq n_{\sigma}<4 ; green), and the dense Hyperion peaks ( n σ ≥ 4 n_{\sigma}\geq 4 ; red). Error bars represent the total uncertainties on the AGN fractions, combining the Monte Carlo realizations and Bayesian binomial confidence intervals. The highest X-ray AGN fraction is observed in the dense Hyperion peaks, while the outskirts are consistent with the coeval field within the uncertainties.
- 2611.07047v1: The HST-Hyperion Survey: X-ray AGN Enhancement in the Hyperion Proto-supercluster
Because AGN incidence depends strongly on host-galaxy stellar mass, we examined whether differences in the stellar mass distributions of Hyperion and the coeval field could contribute to the observed environmental trends, despite the imposition of a stellar mass cut. Figure 4 compares the stellar mass distributions of the mass-selected galaxy populations and X-ray AGN hosts, as well as the full-band absorption-uncorrected X-ray luminosity distributions of the AGN. Two-sample KS tests were performed independently for each of the 100 MC realizations. We find median values of D = 0.094 D=0.094 and p = 0.236 p=0.236 for the full galaxy samples, D = 0.222 D=0.222 and p = 0.784 p=0.784 for the X-ray AGN host masses, and D = 0.319 D=0.319 and p = 0.364 p=0.364 for the full-band X-ray luminosities. AD tests on the stellar-mass distributions show consistent results, with median A 2 = 0.907 A^{2}=0.907 and p = 0.136 p=0.136 for the stellar-mass distribution of the full galaxy samples and A 2 = − 0.683 A^{2}=-0.683 and p = 0.750 p=0.750 for the stellar-mass distribution of the X-ray AGN hosts. Neither test provides evidence that the stellar mass distributions differ significantly between Hyperion and the field, although the small number of X-ray AGN limits the statistical power of these comparisons.
- 2611.07047v1: The HST-Hyperion Survey: X-ray AGN Enhancement in the Hyperion Proto-supercluster
Figure 4: Cumulative distributions of stellar mass (left), X-ray AGN host stellar mass (middle), and full-band ( 0.5 − 10 0.5-10 keV) X-ray luminosity (right) for the Hyperion and coeval field samples. Two-sample KS tests across the 100 Monte Carlo realizations give median p p -values of 0.236 0.236 , 0.784 0.784 , and 0.364 0.364 , respectively. We find no statistically significant differences between the Hyperion and coeval field distributions in any of the three comparisons.
- 2611.07047v1: The HST-Hyperion Survey: X-ray AGN Enhancement in the Hyperion Proto-supercluster
We find an enhanced AGN fraction within Hyperion relative to the coeval field at z ≈ 2.5 z\approx 2.5 . This enhancement is concentrated in the densest regions, with the highly overdense peaks exhibiting an enhanced AGN fraction relative to the field while the lower-density outskirts are consistent with the field. This suggests that local environmental conditions within Hyperion may promote SMBH accretion during the early stages of cluster formation.
- 2610.19317v1: Deep X-ray View of a Distant Protocluster Anchored by a Quasar at $z=6.63$: No Evidence for Enhanced X-ray AGN Activity
We constructed a catalog of 251 sources detected in at least one of the full (0.5–7 keV), soft (0.5–2 keV), and hard (2–7 keV) bands; 247 are detected in the full band. The minimum 2.6 σ \sigma full-band flux limit is 1.34 × 10 − 16 erg s − 1 cm − 2 1.34\times 10^{-16}~\mathrm{erg~s^{-1}~cm^{-2}} . We identified secure multiwavelength counterparts for 227 sources (90.4%) and plausible counterparts for a further 20 (8.0%). The cumulative number counts are broadly consistent with the empirical broken-power-law relation of Georgakakis et al. [45] and measurements from other deep fields. See Section II .
- 2610.19317v1: Deep X-ray View of a Distant Protocluster Anchored by a Quasar at $z=6.63$: No Evidence for Enhanced X-ray AGN Activity
None of the 21 spectroscopically confirmed galaxies in the adopted protocluster redshift interval is individually detected in X-rays; their 90% upper limits span L 2 − 10 keV ≲ ( 2 CLOSE L_{\rm 2-10~keV}\lesssim(2 – OPEN 13 ) × 10 43 erg s − 1 13)\times 10^{43}~\mathrm{erg~s^{-1}} . Stacking all 21 galaxies ( ∼ 17 \sim 17 Ms total exposure) yields no significant signal and constrains the average luminosity to L 2 − 10 keV ≤ 9.54 × 10 42 erg s − 1 L_{\rm 2-10~keV}\leq 9.54\times 10^{42}~\mathrm{erg~s^{-1}} . See Sections III.1 and III.2 .
- 2610.10522v1: Widespread steep X-ray spectra of luminous $z\simeq5.85-7.5$ quasars and their implications for future X-ray surveys
To account for the measurement uncertainties, we repeated the KS test over 10 000 10\,000 Monte Carlo realizations. At each iteration, one Γ \Gamma value was randomly drawn for each source from the corresponding split-normal distribution, and the KS statistic was recomputed. The resulting distribution of KS statistics has a median value of D = 0.51 − 0.09 + 0.08 D=0.51^{+0.08}_{-0.09} , while the median significance is 1 − P = 0.9906 1-P=0.9906 . Approximately 98 % 98\% of the realizations yield 1 − P > 0.95 1-P>0.95 , confirming that the difference between the two Γ \Gamma distributions remains statistically significant after fully propagating the individual measurement uncertainties.
- 2610.10522v1: Widespread steep X-ray spectra of luminous $z\simeq5.85-7.5$ quasars and their implications for future X-ray surveys
∙ \bullet The α OX \alpha_{\rm OX} and κ bol x \kappa^{x}_{\rm bol} of the z ≳ 6 z\gtrsim 6 QSOs analysed here are broadly consistent with the trends observed in highly accreting AGN at lower- z z (see Fig. 7 ). In particular, we identify an X-ray weakness fraction of ∼ 8 − 14 % \sim 8-14\% (2 secure detections plus two upper-limit sources that cannot be excluded as X-ray weak; Sect. 4.2 ), consistent within the large statistical uncertainties with the fractions reported for other highly accreting QSO samples, and likely a lower limit given the count-based selection of our sample.
- 2606.03667v1: Constraining AGN accretion physics with black hole mass-luminosity scaling relations
Magnetorotational instabilities driving magnetohydrodynamic (MHD) turbulence together with MHD winds provide efficient angular momentum transport, see the review of [ 9 ] . One of the main results of MHD disk models is that magnetically supported disks do not develop thermal instabilities, as shown by [ 53 ] for accretion around 10 solar masses BHs and by [ 22 ] for Eddington limited accretion on super-massive BHs. [ 23 ] extend this work to super-Eddington accretion ( M ˙ = 250 − 520 L E d d / c 2 \dot{M}=250-520L_{Edd}/c^{2} ). The [ 53 ] simulations use a general-relativistic (GR) MHD code. The [ 22 ] and [ 23 ] simulations use a pseudo-Newtonian potential. More recently, [ 76 ] presented full GRMHD simulations of radiation dominated accretion flows around stellar mass BHs.
- 2606.03667v1: Constraining AGN accretion physics with black hole mass-luminosity scaling relations
A smaller corona can result from disturbances caused by nuclear winds and outflows, if the launching radii of these winds are comparable with the corona extension. For example, dense clumps in the winds can enhance the corona cooling via bremsstrahlung emission. Fast nuclear winds with column high densities, up to 10 24 10^{24} cm -2 or even above this density, the so called Ultra Fast Outflows, have been observed in a large fraction of AGN and quasars (e.g. [ 60 ] , [ 19 ] , [ 12 ] and references therein). Recent XRISM observations showed that these winds can be highly clumpy, with several clouds along each line of sight [ 73 ] . These dense clouds can enhance corona cooling and can efficiently shield further outflows from nuclear ionizing radiation, in particular X-rays, allowing for the presence of outflows that are not fully ionized, for example broad line region (BLR) winds, even at relatively small radii. In this case, a small/disturbed corona should be accompanied by UFOs and by fast BLR winds. A significant anticorrelation between the velocity shift of the CIV line centroid and the systemic redshift (a proxy for a BLR wind velocity) and the X-ray weakness (parameterized using α O X \alpha_{OX} , the UV to X-ray power law index) has indeed been reported in the past ( [ 64 ] , [ 74 ] , [ 10 ] . and references therein). We revisit this result in figure 2 , showing the correlation between the velocity shift from CIV centroid and the centroid of a low ionization line (MgII), assumed to be close to systemic redshift, and k X = L 2 − 10 k e V / L b o l k_{X}=L_{2-10keV}/L_{bol} for 230 quasars in the SDSS-eROSITA sample with both CIV and MgII in the SDSS spectra and the WISSH and HYPERION samples. The color of the points in the left panel is proportional to the excess of CIV FWHM, calculated by subtracting in quadrature the MgII FWHM from the total CIV FWHM. If the MgII FWHM is dominated by virial gas motion, the excess CIV FWHM should thus be proportional to the BLR velocity, similarly to the CIV velocity shift. We see that the points on the upper envelope of the observed CIV shift - k X k_{X} , highlighted by the dashed line with slope -0.5, also
- 2610.19320v1: Large-scale Environmental Dependence of AGN Activity Revealed by JWST Pa$α$ Emitters
Different studies report inconsistent results of the AGN large-scale environmental dependence on AGN and host-galaxy properties, from the nearby Universe to cosmic noon. The relation between radio power and environmental density is controversial. While some studies have reported no significant dependence [ 67 , 30 , e.g.,] , others have found a negative trend [ 43 , e.g.,] or a positive trend [ 11 , e.g.,] . The environmental dependence of M BH M_{\mathrm{BH}} and accretion rate shows no significant trends with substantial scatter [ 23 , 68 , e.g.,] . Such studies mostly rely on photometric data and ground-based spectroscopic surveys. The former suffer from photometric-redshift uncertainties, while the latter are restricted to bright galaxies and provide an incomplete census of the surrounding galaxy population.
- 2610.19320v1: Large-scale Environmental Dependence of AGN Activity Revealed by JWST Pa$α$ Emitters
We perform a Markov Chain Monte Carlo (MCMC) analysis using the Python code emcee [ 13 ] to determine the best-fit parameters Φ ∗ \Phi_{*} , α \alpha , and L ∗ L_{*} . The resulting LFs are shown in Figure 5 , with the corresponding values presented in Appendix C .
- 2609.10319v1: Extending the Little Red Dot population at intermediate redshift with VIPERS
The VIPERS spectroscopic results, such as spectroscopic redshifts, are complemented by ancillary information. We especially leverage the multiwavelength photometric catalogue, taken from the VIPERS database ( Moutard et al., 2016 ) , which contains observations from ultraviolet (UV) to mid-infrared (MIR) wavelengths. Throughout this study, we use the following bands from the catalogue: far-UV (FUV) and near-UV (NUV) from Galaxy Evolution Explorer (GALEX); u, g, r, i, z, y from CFHTLS photometric measurements; K s from the CFHT Wide-field Infrared Camera (WIRCam); K from Visible and Infrared Survey Telescope for Astronomy (VISTA) Deep Extragalactic Observations (VIDEO) survey ( Jarvis et al., 2013 ) ; W1, W2, W3, and W4 passbands (3.4, 4.6, 12.1, and 22.5 μ \mu m) from NASA’s Wide-field Infrared Survey Explorer ( Wright et al., 2010 , WISE;) .
- 2609.10319v1: Extending the Little Red Dot population at intermediate redshift with VIPERS
Table 1: Summary of our selection.
- 2505.05556v1: Super-Eddington accretion in high-redshift quasar hosts: Black-hole driven outflows, galaxy quenching, and the nature of little red dots
These results allow us to improve the comparison with observed outflows. In particular, we first rescale the observed estimates to the MBH masses and luminosities of our source ( M BH ∼ 5 × 10 7 M ⊙ M_{\rm BH}\sim 5\times 10^{7}\rm\,M_{\odot} and L BH ∼ 10 45 erg s − 1 L_{\rm BH}\sim 10^{45}\rm\,erg\,s^{-1} ), using the scaling relations obtained for molecular and ionised winds in the local Universe ( OPEN 0.1 ≲ z ≲ 3 ) 0.1\lesssim z\lesssim 3) by Fiore et al. (2017) . In the low-redshift sample, molecular outflow rates are of the order of hundreds of M ⊙ yr − 1 \rm M_{\odot}\ yr^{-1} , measured at distances between 0.1 and 3 kpc from the galactic centre. Compared to observations, our mass outflow rate is still approximately one order of magnitude lower. However, it is important to highlight that the observed molecular outflows at low-redshift are typically detected in the very central regions of galaxies, while in our case, at a distance of 2 kpc, we are already probing the CGM, outside the simulated galaxy. Additionally, our simulations have certain limitations: first, we may not have a high enough resolution to resolve the formation of molecular gas within outflows ( Richings & Faucher-Giguère, 2018b ) . Secondly, by already being outside the galaxy, the gas can mix with the hot gas in the halo, and is also exposed to the dissociating UV background, which may prevent molecule formation altogether. As for ionized winds instead, the radii at which they are typically observed range from sub-kpc scales up to tens of kpc, which are comparable to the distances probed in our simulation. In this case, our results are more consistent with the observations: for a galaxy with the same bolometric luminosity as in our simulation, we find comparable mass outflow rates of the order of 1 − 100 M ⊙ yr − 1 1-100\ \rm M_{\odot}\ yr^{-1} , except around the time of the feedback-driven cavity formation, where we expect enhanced outflow activity.
- 2505.05556v1: Super-Eddington accretion in high-redshift quasar hosts: Black-hole driven outflows, galaxy quenching, and the nature of little red dots
While the intrinsic properties of simulated galaxies give us important information about the physical modelling, they do not directly allow us to compare results with observations. For this reason, we consider here how MBH accretion and the related AGN feedback shapes the host galaxy emission, by analysing the spectral evolution and observational features associated to the simulated galaxy during and after the sustained phase of super-Eddington growth discussed in the previous Section. We use the open-source Synthesizer package ( Vijayan et al., 2020 ; Wilkins et al., 2020 ) 2 2 2 https://synthesizer-project.github.io/synthesizer/ , which allows to generate realistic galaxy observables and mock spectra from cosmological simulations. The emerging spectrum of the galaxy stellar component is computed based on the stellar particle mass, age and metallicity, taking into account nebular emission, photoionisation reprocessing and dust attenuation. 3 3 3 We assume intrinsic stellar emission from the BPASS stellar population synthesis code ( Byrne et al., 2022 ) , including binary stars and adopting a Chabrier initial mass function ( Chabrier, 2003 ) extending between M ⋆ = 0.3 − 100 M ⊙ M_{\star}=0.3-100\,\mathrm{M}_{\odot} . We assumed here a Calzetti attenuation law ( Calzetti et al., 2000 ) , and self-consistently derived the dust attenuation from the gas distribution and metallicity provided by the simulation within 1 kpc from the galaxy centre. The AGN spectrum instead is consistently modelled starting from a multi-component accretion disc continuum ( Mathews & Ferland, 1987 ) , and includes the reprocessed emission form the broad line region (BLR), narrow line region (NLR) and dusty torus, assuming dust attenuation following A λ ∝ λ − 2 A_{\lambda}\propto\lambda^{-2} .
- 2505.24308v1: Inferring Obscured Cosmic Black Hole Accretion History from AGN Found by JWST/MIRI CEERS Survey
This study presents the black hole accretion history (BHAH) of obscured active galactic nuclei (AGNs) identified from the JWST CEERS survey by Chien et al. (2024) using mid-infrared (MIR) SED fitting. We compute black hole accretion rates (BHARs) to estimate the black hole accretion density (BHAD), $ρ_{L_{\mathrm{disk}}}$, across $0 < z < 4.25$. MIR luminosity functions (LFs) are also constructed for these sources, modeled with modified Schechter and double power law forms, and corresponding BHAD, $ρ_{\mathrm{LF}}$, is derived by integrating the LFs and multiplying by the luminosity. Both $ρ_{\mathrm{LF}}$ extend to luminosities as low as $10^7 \, L_{\odot}$, two orders of magnitude fainter than pre-JWST studies. Our results show that BHAD peaks between redshifts 1 and 3, with the peak varying by method and model, $z \approx 1$--2 for $ρ_{L_{\mathrm{disk}}}$ and the double power law, and $z \approx 2$--3 for the modified Schechter function. A scenario where AGN activity peaks before cosmic star formation would challenge existing black hole formation theories, but our present study, based on early JWST observations, provides an initial exploration of this possibility. At $z \sim 3$, $ρ_{\mathrm{LF}}$ appears higher than X-ray estimates, suggesting that MIR observations are more effective in detecting obscured AGNs missed by X-ray observations. However, given the overlapping error bars, this difference remains within the uncertainties and requires confirmation with larger samples. These findings highlight the potential of JWST surveys to enhance the understanding of co-evolution between galaxies and AGNs.
- 2510.02193v1: The role of environment in triggering AGN -- evidence for a change at $z\sim$1
It is important that we use luminosity complete bins. Otherwise, we mix lower luminosity sources at somewhat lower redshift with higher luminosity sources at somewhat higher redshift within the same redshift bin. This would confuse our results in the presence of any luminosity-dependent effects. This is why a large number of lower luminosity AGN are excluded from the lower- z z bins in Figures 4 - 6 . We note that for the X-ray sample the luminosity complete limits are nearly the same for both redshift bins, whereas for the IR samples we have about 0.5 dex difference. While this is not a large difference, it is conceivable that the redshift dependent effects we see for the IR AGN are partly luminosity-dependent. We attempted to explore this using multiple luminosity bins per redshift bin but found that we do not have the statistics for conclusive results.
- 2510.02193v1: The role of environment in triggering AGN -- evidence for a change at $z\sim$1
Due to the low formal significance of our results in Figures 4 , 5 , and 6 , we employ bootstrapping to test the strength of the results, specifically the reversal in dependence seen in both IR samples around z ∼ 1.2 z\sim 1.2 . We randomly resampled the IR and IR-only AGN with replacement 1000 times and calculated the scores for each using equation 5 . The results are shown in Figure 7 . In each IR AGN sample we see a clear difference in the peaks of the scores of the bootstrapped samples. For AGN in the redshift range 0.1 < z < 1.2 0.1<z<1.2 the samples peak strongly at negative scores around ∼ − 0.5 \sim-0.5 with 95 % 95\% of the IR samples and 98 % 98\% of the IR-only bootstrapped samples having negative scores corresponding to negative dependencies between AGN occurrence and environmental density. For AGN in the redshift range 1.2 < z < 1.6 1.2<z<1.6 the samples peak with positive scores of ∼ 0.5 \sim 0.5 with 98 % 98\% of both the IR and IR-only bootstrapped samples having positive scores. These results highlight the result of Figures 5 , and 6 showing a reversal of dependence for both the IR AGN and the heavily obscured IR-only AGN samples around z ∼ 1.2 z\sim 1.2 .
Abstract
Dense environments can influence both galaxy evolution and supermassive black hole growth, but whether they enhance or suppress (or both) active galactic nuclei (AGN) activity at high redshift ($z\gtrsim2$) remains uncertain. As one of the most massive structures identified in the early universe, the Hyperion proto-supercluster at $z\approx2.5$ provides a unique opportunity to investigate this connection during an epoch near the peak of both cosmic star formation rate and AGN activity density. To examine the impact of galaxy environment on AGN activity, we measure the fraction of X-ray-selected AGN in Hyperion as a whole, its highly overdense peaks, and its outskirts, comparing these measurements to a coeval field sample. We identify X-ray AGN using the deep Chandra COSMOS-Legacy Survey and combine optical/near-infrared (NIR) photometry and photometric redshift information from COSMOS2020 with extensive ground-based spectroscopy and HST-grism observations. Redshift information is incorporated statistically using a Monte Carlo framework. We find a higher X-ray AGN fraction in Hyperion ($7.4^{+3.2}_{-1.8}\%$) than in the coeval field ($3.2^{+0.6}_{-0.5}\%$), corresponding to a $\sim2.3σ$ difference. Strikingly, this enhancement is concentrated in the overdense peaks, where the X-ray AGN fraction reaches $12.3^{+5.5}_{-3.4}\%$ ($15.0^{+6.9}_{-4.4}\%$ in the most massive peaks versus $6.2^{+11.9}_{-2.1}\%$ in the less massive peaks), while the lower-density Hyperion outskirts ($2.1^{+3.6}_{-1.1}\%$) show no evidence of enhancement relative to the field. These results add to the limited but growing evidence for enhanced AGN activity in high-redshift protostructures, suggesting that the dense environments at these epochs may preferentially trigger AGN during the early stages of cluster assembly.
Discussion
Discussion access requires a security token. Register for the weekly digest.