2611.00195v1 · First listed 2026-11-03
EMBER: A Little Red Dot Candidate at $z_{\rm spec}=10.36$ in the Seed Black Hole Era
JWST/NIRSpec finds CW-LRD-z10 at zspec=10.361, with a Balmer-limit V-shaped continuum and tentative high-ionization/auroral lines. It is a strong z>10 LRD candidate, but present spectroscopy does not unambiguously establish either broad-line or AGN status. [1][4][10]
Evidence
The one-object EMBER NIRSpec/PRISM follow-up targeted a COSMOS-Web source selected through joint NIRCam–MIRI colours, with zphot=10.5+0.7/-0.6. A Lyα break plus several S/N≈2–4 features yield zspec=10.361+0.003/-0.002; the most significant reported lines are C IV (S/N=3.9) and [O III] λ4363 (3.6). A stacked-line test provides supporting, rather than independent high-significance individual-line, evidence. The measured MUV is −20.16±0.07. The continuum is better described by a broken than single power law (ΔBIC=17.7): βUV=−2.26±0.11, βopt=1.17+0.74/-0.70, and turnover 0.356+0.010/-0.013 μm, consistent with the Balmer limit. Its F444W−F770W=1.82 has an F770W S/N=18 detection. [7][8][9][10][5]
Earlier work
The authors compare the two continuum slopes and Balmer-limit turnover specifically with lower-redshift LRDs, arguing that both are typical of that population. They also state that no LRD had previously been spectroscopically confirmed above z=10. The supplied material does not provide the measurements or selection functions of those earlier LRD samples, so a quantitative population comparison is not possible here. Separately, earlier LRD work reports Lyα occurrence rates of 39±12% for LRDs and similarity to normal star-forming galaxies at the same redshifts; this contextualizes, but does not by itself explain, the tentative Lyα emission in this source. [2][1][11]
What changes
This paper extends spectroscopic redshift evidence for an LRD candidate to z=10.361 and tests its classification with both continuum fitting and rest-optical MIRI photometry. The authors argue that a stellar Balmer-break interpretation would need Hα EW≈(6±1)×10^3 Å to match F770W, exceeding the cited theoretical ≲4000 Å and typical extreme-emitter ≈2000 Å values. They further report possible UV iron and elevated [O III] λ4363/Hγ as AGN-like clues, not decisive AGN diagnostics. [1][5]
Limits and open questions
“Candidate” remains essential: broad Hα and Hβ lie outside the PRISM coverage, while individual emission lines are only S/N=2–4. The authors explicitly say unambiguous LRD spectroscopy is not achieved. Star-formation ionization cannot be excluded, and dust-reddened or Compton-thick AGN scenarios remain viable despite reported ALMA and X-ray non-detections. Longer-wavelength spectroscopy is needed to distinguish origins of the red optical continuum and establish the physical power source. [4][6][10]
Evidence includes selected full-text excerpts and figure captions, not the complete paper. Detailed extraction/model-fitting procedures, line-flux posteriors, and selection completeness are therefore not available beyond the reported results.
Key figures
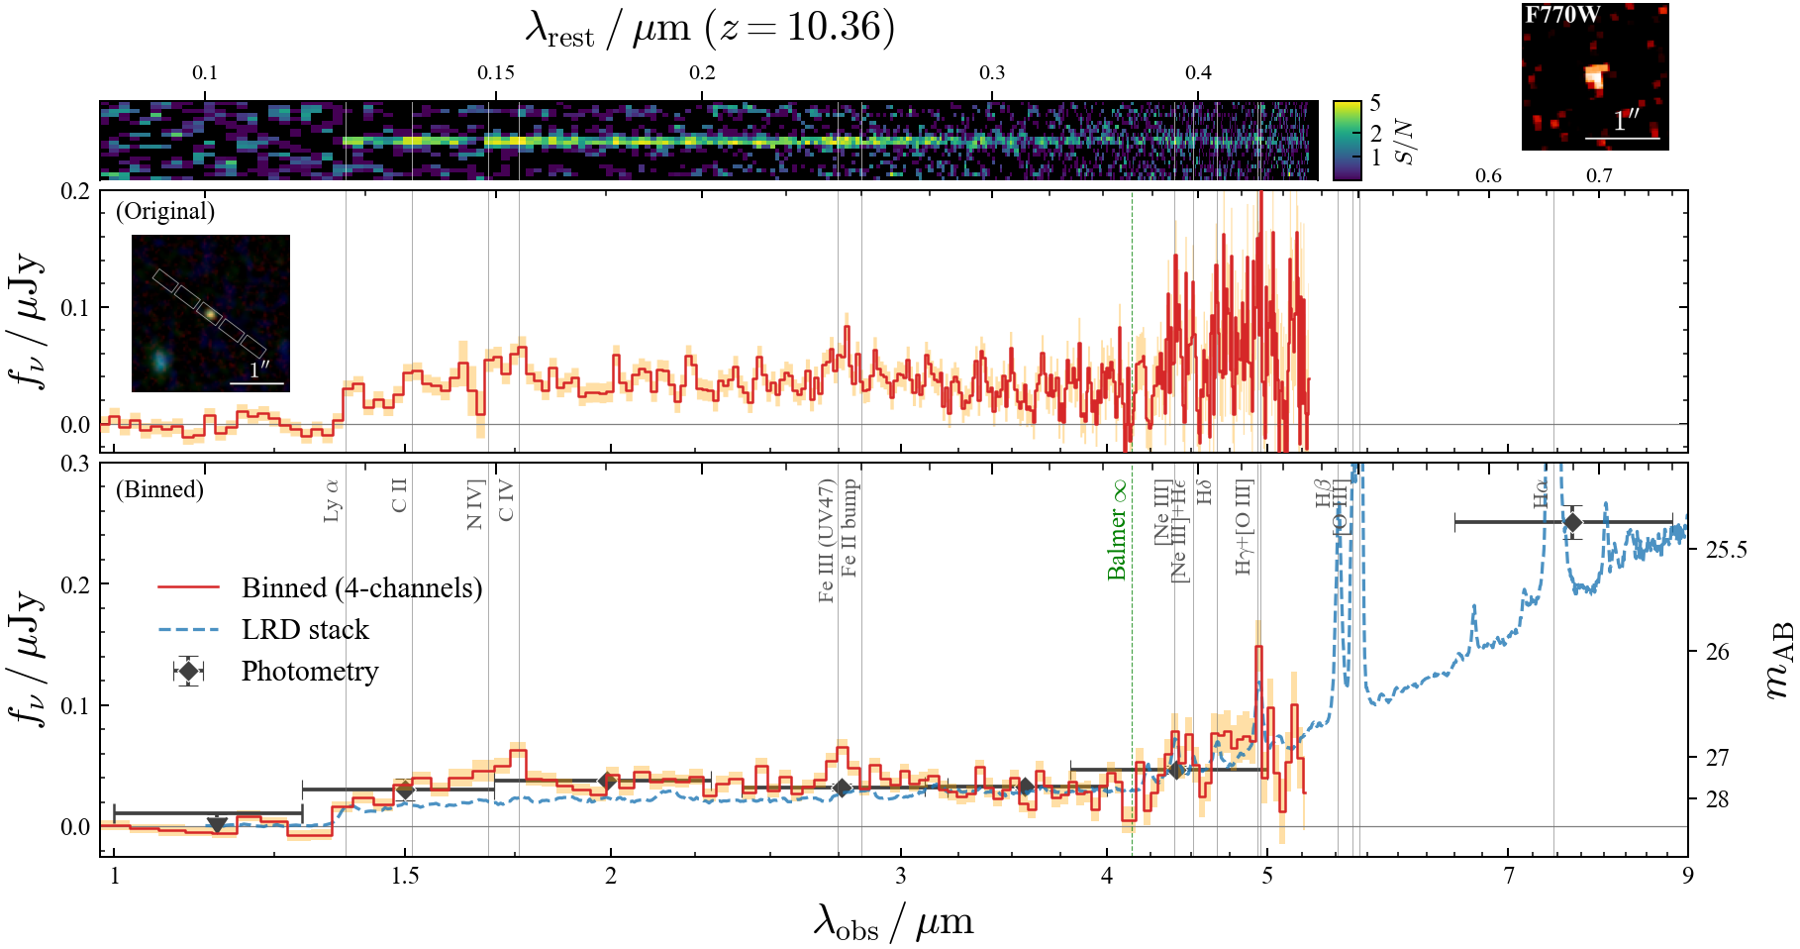
Tests the basic spectral and photometric consistency of the source: nod-subtracted and optimally extracted PRISM spectra, four-channel binning, and comparison to a continuum-scaled stack of 274 LRDs. It visually assesses the Lyα break and V-shaped SED.
Original caption
Figure 1: JWST /NIRSpec PRISM spectrum of CW-LRD-z10. The top panel shows the nod-subtracted 2D spectrum produced by the JWST science calibration pipeline. The middle panel shows the optimally extracted 1D spectrum, and the bottom panel compares the spectrum, binned by taking the inverse-variance-weighted average over every four spectral channels, with the photometry reported in [ 100 ] . Uncertainties ( 1 σ 1\sigma ) are shown as the orange shaded region. The inset in the middle panel shows the NIRCam 3 ′′ × 3 ′′ 3^{\prime\prime}\times 3^{\prime\prime} RGB (R: F356W+F444W; G: F200W+F277W; B: F115W+F150W) image overlaid with the NIRSpec slitlet, while the upper-right inset shows a 2 ′′ × 2 ′′ 2^{\prime\prime}\times 2^{\prime\prime} F770W image. In the bottom panel, we overplot a stacked spectrum of 274 274 LRDs compiled from the EMBER survey and archival observations with the dashed line (H. B. Akins et al. in prep. ), scaled to match the continuum of CW-LRD-z10 over λ rest = 0.28 − 0.32 μ m \lambda_{\rm rest}=0.28\,\mathchar 45\,0.32\,{\rm\mu m} . The spectrum exhibits the Ly α \alpha break at ∼ 1.3 − 1.4 μ m \sim 1.3\,\mathchar 45\,1.4\,{\rm\mu m} and a slight upturn redward of ∼ 4.2 μ m \sim 4.2\,{\rm\mu m} , consistent with a V V -shaped SED of typical LRDs redshifted to z ∼ 10 z\sim 10 .

Places CW-LRD-z10 in MUV–redshift space against previously spectroscopically confirmed LRDs, testing whether its UV luminosity is exceptional relative to that comparison set. The text reports MUV=−20.16±0.07 and calls it comparable to the most UV-luminous LRDs.
Original caption
Figure 3: UV absolute magnitudes ( M UV M_{\rm UV} ) of previously spectroscopically confirmed LRDs [ 73 , 52 , 65 , 16 ] as a function of redshift. Note that there can be an overlap between different studies. The red star indicates CW-LRD-z10 (this study), representing the first LRD candidate with z spec > 10 z_{\rm spec}>10 , corresponding to a cosmic age of < 0.5 Gyr <0.5\,{\rm Gyr} .

Tests whether several weak line locations coherently favor the proposed redshift: mean/median stacks and leave-one-out fits peak near z≈10.36. This supports the line interpretation but does not turn the individual low-S/N features into secure detections.
Original caption
Figure 4: (Left) Continuum-subtracted stacked spectrum of [Ne iii ] λ 3869 \lambda 3869 , [Ne iii ] λ 3967 \lambda 3967 + H ϵ \epsilon , H δ \delta , H γ \gamma , and [O iii ] λ 4363 \lambda 4363 assuming z = 10.36 z=10.36 . The red solid and black dashed lines show mean- and median-stacked spectra, respectively. 1 σ 1\sigma uncertainties are shown as the shaded regions. (Right) S / N S/N from the Gaussian fitting when redshift is varied. The gray thin lines indicate the results from the leave-one-out test. The stack S / N S/N peaks at z ∼ 10.36 z\sim 10.36 , providing additional support for z spec = 10.36 z_{\rm spec}=10.36 .
Related research
Previous digest
Tanaka et al. present EMBER’s JWST/NIRSpec PRISM spectrum of CW-LRD-z10, measuring z_spec = 10.361 and making it the highest-redshift little red dot candidate known. A prominent Lyα break, tentative C IV and [O III] λ4363, an extreme F444W−F770W color, and the characteristic V-shaped continuum collectively place the source in the LRD population, while a possible UV iron complex and elevated [O III] λ4363/Hγ are consistent with an AGN-like ionizing source. The result pushes observational evidence for compact, rapidly growing black-hole candidates into the seed-black-hole era, with tentative Lyα emission also potentially signaling unusually transparent sightlines at z≈10. The AGN interpretation remains provisional because its key line detections and diagnostic ratios are low-significance or affected by blending; planned MIRI spectroscopy is needed to establish the source’s physical nature.
Sources and evidence (26)
- 2611.00195v1: EMBER: A Little Red Dot Candidate at $z_{\rm spec}=10.36$ in the Seed Black Hole Era
Little red dots (LRDs) are a newly discovered population that may trace rapidly growing black holes (BHs) and provide a link between seed BHs and luminous active galactic nuclei (AGNs). However, no LRD had previously been spectroscopically confirmed at $z>10$, leaving this earliest phase observationally unexplored. Using JWST/NIRSpec spectroscopy from the EMBER program, we measure a spectroscopic redshift of $z_{\rm spec}=10.361^{+0.003}_{-0.002}$ for \target, the highest-redshift LRD candidate known to date. The redshift is constrained by a prominent Ly$α$ break and multiple tentative emission lines, including C\,{\sc iv}\,$λ\lambda1549,1551$ and [O\,{\sc iii}]\,$\lambda4363$ detected at $S/N=3.9$ and $3.6$, respectively. Its extreme NIRCam-MIRI color of $m_{\rm F444W}-m_{\rm F770W}=1.82\pm0.1$, characteristic V-shaped continuum with a turnover near the Balmer limit, and continuum slopes of $β_{\rm UV}=-2.26^{+0.11}_{-0.11}$ and $β_{\rm opt}=1.17^{+0.74}_{-0.70}$ all support its LRD nature. A possible iron complex at $λ_{\rm rest}\sim0.24$--$0.25\,{\rm μm}$ and a possibly high $\log\left([{\rm O\,III]\,\lambda4363/\rm Hγ}\right)=0.17^{+0.24}_{-0.22}$ further support an AGN-like interpretation, as seen in previously known LRDs. Tentative detection of Ly$α$ emission may indicate enhanced Ly$α$ transmission at $z\sim10$. Our findings extend the observational frontier of BH growth into the seed-BH formation era, and upcoming MIRI spectroscopy will further establish the physical nature of the source.
- 2611.00195v1: EMBER: A Little Red Dot Candidate at $z_{\rm spec}=10.36$ in the Seed Black Hole Era
The fit with the BPL continuum with IGM+CGM absorption and emission lines results in β UV = − 2.26 − 0.11 + 0.11 \beta_{\rm UV}=-2.26^{+0.11}_{-0.11} and β opt = 1.17 − 0.70 + 0.74 \beta_{\rm opt}=1.17^{+0.74}_{-0.70} . Both of the fitted spectral slopes, as well as their large difference across the turnover, are consistent with those typically observed in lower- z z LRDs [ 52 , 16 , 6 , 3 , e.g.,] . Furthermore, the BPL model is strongly favored over the SPL model with β = − 2.01 − 0.10 + 0.11 \beta=-2.01^{+0.11}_{-0.10} by the BIC improvement of Δ BIC = 17.7 > 10 \Delta{\rm BIC}=17.7>10 , a conventional threshold for strong evidence in model selection, confirming a significant change in the continuum slope. This continuum-slope change is more clearly visible in the 4-channel binned spectrum (Figure 1 , lower). Furthermore, the fitted turnover wavelength is λ turn = 0.356 − 0.013 + 0.010 μ m \lambda_{\rm turn}=0.356^{+0.010}_{-0.013}\,{\rm\mu m} , which is consistent with the Balmer limit ( λ rest = 0.3646 μ m \lambda_{\rm rest}=0.3646\,{\rm\mu m} ) within the uncertainties, as commonly seen in LRDs [ 93 , 16 , e.g.,] .
- 2611.00195v1: EMBER: A Little Red Dot Candidate at $z_{\rm spec}=10.36$ in the Seed Black Hole Era
In Section IV.1 , we established that the source lies at z = 10.36 z=10.36 rather than being a low-redshift interloper. In this section, we discuss whether the observed SED at z = 10.36 z=10.36 necessarily requires an LRD interpretation, or whether it could instead arise from a non-LRD component.
- 2611.00195v1: EMBER: A Little Red Dot Candidate at $z_{\rm spec}=10.36$ in the Seed Black Hole Era
There is currently no community-wide consensus on a definitive definition of LRDs. Nevertheless, three key characteristics are commonly used to identify them: a compact morphology, a V-shaped continuum with a minimum around or redward of the Balmer limit, and broad Balmer emission lines [ 34 , 16 , e.g.,] . For CW-LRD-z10, Tanaka et al. [100] confirmed its compact morphology, and, in this work, we spectroscopically confirm its redshift ( z spec = 10.36 z_{\rm spec}=10.36 , Section IV.1 ) and the presence of the characteristic V-shaped continuum, with its turnover at the Balmer limit (Section IV.2 ). However, broad Balmer lines have not yet been spectroscopically confirmed because H β \beta and H α \alpha fall outside the wavelength coverage of the current NIRSpec/PRISM spectrum (Figure 1 ). Although the possibly high [O iii ] λ 4363 \lambda 4363 / H γ {\rm H\gamma} ratio (Section IV.4 ) and the possible iron emission (Section IV.5 ) support its LRD or AGN nature, an unambiguous spectroscopic confirmation has not yet been achieved.
- 2611.00195v1: EMBER: A Little Red Dot Candidate at $z_{\rm spec}=10.36$ in the Seed Black Hole Era
We therefore consider whether the observed SED at z = 10.36 z=10.36 could instead be explained by a stellar-origin Balmer break. Such a model could in principle reproduce the turnover, and the iron complex and the high O3Hg ratio could arise from an AGN component. However, this alternative solution is strongly disfavored by the extremely red NIRCam-MIRI color of CW-LRD-z10, m F444W − m F770W = 1.82 m_{\rm F444W}-m_{\rm F770W}=1.82 , based on its robust S / N = 18 S/N=18 detection in F770W [ 100 ] . If the rest-frame optical continuum were approximately flat in f ν f_{\nu} from λ rest ∼ 0.4 − 0.9 μ m \lambda_{\rm rest}\sim 0.4\,\mathchar 45\,0.9\,{\rm\mu m} , as expected for a typical Balmer-break galaxy, reproducing the F770W flux would require an H α \alpha rest-frame equivalent width (EW) of ∼ ( 6 ± 1 ) × 10 3 Å \sim(6\pm 1)\times 10^{3}\,\text{\AA} . Such an extreme EW is substantially larger than those expected theoretically ( ≲ 4000 Å \lesssim 4000\,\text{\AA} ; Inoue 42 ) or typically observed in extreme emission line galaxies ( ∼ 2000 Å \sim 2000\,\text{\AA} ; e.g., Withers et al. 114 ). The F770W detection therefore provides important support for the LRD nature of CW-LRD-z10. We further confirm that CW-LRD-z10 is independently detected in each of the four individual COSMOS-Web F770W exposures prior to mosaicing, indicating that the F770W signal is unlikely to be caused by an imaging artifact.
- 2611.00195v1: EMBER: A Little Red Dot Candidate at $z_{\rm spec}=10.36$ in the Seed Black Hole Era
Another possible explanation for the red rest-optical continuum is dust-reddened AGN emission [ 53 , 73 , 28 , 68 , 67 , e.g.,] . However, the observed turnover near the Balmer limit is characteristic of previously observed LRDs [ 93 , 16 ] , whereas such a coincidence is not necessarily expected from simple dust reddening. Furthermore, the tentative C iv and UV iron emission features, commonly associated with AGN activity, suggest that at least part of the nuclear UV emission is visible without severe obscuration. This may be in tension with a uniformly dust-obscured AGN, although more complex geometries involving partial covering or scattering, as well as non-standard dust attenuation curves [ 62 ] , remain possible. Moreover, despite the ALMA non-detection [ 100 ] , obscuration by dust hotter than that effectively probed by the available ALMA observations, or by a compact dust distribution with a small global covering factor, cannot be excluded [ 11 , 68 , 19 ] . Similarly, the X-ray non-detection [ 100 ] does not rule out the possibility of a Compton-thick AGN. Therefore, while the observed properties are consistent with an LRD-like interpretation, we cannot rule out dust-obscured AGN scenarios with the current data. On the other hand, previous studies have not ruled out the possibility that dust attenuation also contributes to the red rest-optical continua of LRDs themselves [ 68 , e.g.,] . Thus, dust-reddened AGN and other proposed LRD scenarios are not necessarily mutually exclusive, and it remains unclear whether they can be observationally distinguished with the currently available data. Further observations at longer wavelengths are needed to distinguish between these scenarios and better constrain the physical origin of the red rest-optical continuum.
- 2611.00195v1: EMBER: A Little Red Dot Candidate at $z_{\rm spec}=10.36$ in the Seed Black Hole Era
CW-LRD-z10 is a robust z > 10 z>10 LRD candidate with z phot = 10.5 − 0.6 + 0.7 z_{\rm phot}=10.5^{+0.7}_{-0.6} selected from the COSMOS-Web dataset using a joint NIRCam-MIRI color selection [ 100 ] . We present the NIRSpec/PRISM spectrum of CW-LRD-z10 (Figure 1 ) taken in the EMBER program. The key results are as follows:
- 2611.00195v1: EMBER: A Little Red Dot Candidate at $z_{\rm spec}=10.36$ in the Seed Black Hole Era
Based on the clearly detected Ly α \alpha break and emission lines with S / N ∼ 2 − 4 S/N\sim 2\,\mathchar 45\,4 (Figure 2 ), we spectroscopically measure the redshift as z = 10.361 − 0.002 + 0.003 z=10.361^{+0.003}_{-0.002} , consistent with the photometric redshift (Section IV.1 ). The corresponding UV absolute magnitude is M UV = − 20.16 − 0.07 + 0.07 M_{\rm UV}=-20.16^{+0.07}_{-0.07} , comparable to those of the most UV-luminous LRDs ever found (Figure 3 ). The z spec z_{\rm spec} confirmation removes the principal redshift uncertainty underlying the number density estimates in [ 100 ] .
- 2611.00195v1: EMBER: A Little Red Dot Candidate at $z_{\rm spec}=10.36$ in the Seed Black Hole Era
We spectroscopically confirm a V-shaped SED with UV and optical continuum slopes of β UV = − 2.26 − 0.11 + 0.11 \beta_{\rm UV}=-2.26^{+0.11}_{-0.11} and β opt = 1.17 − 0.70 + 0.74 \beta_{\rm opt}=1.17^{+0.74}_{-0.70} , respectively (Section IV.2 ). The turnover wavelength, λ turn = 0.356 − 0.013 + 0.010 μ m \lambda_{\rm turn}=0.356^{+0.010}_{-0.013}\,{\rm\mu m} , is consistent with the Balmer limit. Both of these findings satisfy key spectroscopic characteristics commonly associated with LRDs.
- 2611.00195v1: EMBER: A Little Red Dot Candidate at $z_{\rm spec}=10.36$ in the Seed Black Hole Era
Line detections are tentative with S / N = 2 − 4 S/N=2\,\mathchar 45\,4 , and C iv λ λ 1549 , 1551 \lambda\lambda 1549,1551 and [O iii ] λ 4363 \lambda 4363 have the highest significances of S / N = 3.9 S/N=3.9 and 3.6 3.6 , respectively. However, the stacking analysis provides additional support for the line interpretation (Figure 4 , Section IV.3 ).
- 2601.10573v1: Origins of the UV continuum and Balmer emission lines in Little Red Dots: observational validation of dense gas envelope models enshrouding the AGN
The Ly α \alpha line occurrence rates in LRDs and LBDs are 39 ± 12 % 39\pm 12\ \% and 22 ± 16 % 22\pm 16\ \% , respectively, and there is no systematic difference depending on the presence of dense gas envelopes invoking the red rest optical continuum. The occurrence rates and the Ly α \alpha equivalent widths of LRDs/LBDs are quite similar to what was found in normal star-forming galaxies at the same redshift range (Figure 4 , Section III.2 ).
- 2601.10573v1: Origins of the UV continuum and Balmer emission lines in Little Red Dots: observational validation of dense gas envelope models enshrouding the AGN
In this section, we discuss the constraint on the models for LRDs from the observational results presented in the previous section. The observed correlations between the UV continuum and H α \alpha lines, together with their luminosity ratios and Ly α \alpha occurrence rates, provide key diagnostics of the dominant ionizing sources. We examine whether various envelope models in the literature can consistently account for these observational constraints and assess their relative plausibility. We mainly focus on the envelope models proposed in literature (see Figure 1 ), but also briefly mention the possibility of other models than envelope models.
- 2605.31077v1: Super-Eddington accretion of black holes in early nuclear bursts gives birth to Little Red Dots
A feedback-regulated initial mass function (IMF). Here, the feedback from the first Pop-III star cluster formed in the collapsed gas of a pristine halo is evaluated to determine the resulting mass of individual stars in the cluster.
- 2605.31077v1: Super-Eddington accretion of black holes in early nuclear bursts gives birth to Little Red Dots
Fig. 2 shows the predicted number density ( n n ) of LRDs as a function of z z based on our default selection (solid red curve). For comparison, we show the observational results from Y. Ma et al. [45] and V. Kokorev et al. [37] , and the empirical prediction by K. Inayoshi [29] . The number density of LRDs predicted by our model recovers the piece-wise evolution found in observations: a plateau at z ≳ 4 z\gtrsim 4 where the number density reaches a few times 10 − 5 cMpc − 3 10^{-5}\,{\rm cMpc}^{-3} and a sharp drop at z ≲ 4 z\lesssim 4 .
- 2507.01355v1: The birth of young radio jets in changing-look AGN: a population study
In order to determine how well we can rule out radio flares associated with changing-look events for the objects in our sample, we consider the radio variability properties of 1ES 1927+654, Mrk 590, and NGC 1566 and whether similar events would be detectable for the other sources given their redshifts and the VAST single-epoch sensitivity of 1-2 mJy. 1ES 1927+654, at redshift z = 0.017 z=0.017 and with BH mass of ∼ 10 6 M ⊙ \sim 10^{6}M_{\odot} , exhibited an increase in 5 GHz radio luminosity from log L 5 GHz = 37.7 \log L_{5\text{GHz}}=37.7 erg s -1 to log L 5 GHz = 39.0 \log L_{5\text{GHz}}=39.0 erg s -1 over 1 year, with this rebrightening taking place 5 years after an optical outburst associated with the temporary appearance of broad lines [ 38 ] . Mrk 590, at redshift z = 0.026 z=0.026 and with BH mass of ∼ 10 8 M ⊙ \sim 10^{8}M_{\odot} , varied from a 5 GHz radio luminosity from log L 5 GHz = 38.25 \log L_{5\text{GHz}}=38.25 erg s -1 in 1995 to log L 5 GHz = 37.65 \log L_{5\text{GHz}}=37.65 erg s -1 in 2014 while its broad lines disappeared between 2003/2006 and 2013, with prior fading observed since 1989 [ 10 ] . NGC 1566, at redshift z = 0.005 z=0.005 and with BH mass of ∼ 10 7 M ⊙ \sim 10^{7}M_{\odot} , varied from a 887.5 MHz radio luminosity from log L 887 MHz = \log L_{887\text{MHz}}= 36.83 to 36.70 erg s -1 while transitioning from a type 1 to 2 state. With our VAST light curves, we observe the tail-end of this trend of radio fading for Mrk 590 and NGC 1566 in 887.5 MHz. We conclude that for the 14 CLAGN with z > > 0.05, we would not actually detect Mrk 590-like luminosities, since they are too faint to see with the VAST 2 mJy limit. The log 10 \log_{10} mass of Mrk 590 is 8.29 and the log 10 \log_{10} masses of the 14 other z > > 0.05 VAST-detected CLAGN lie in the range of 7.40 to 9.32. For the 6 other z < < 0.05 VAST-detected CLAGN, we can rule out a Mrk 590-like flare but not an NGC 1566-like flare. Additionally, 11 of our CLAGN objects are much more radio luminous and radio loud than Mrk 590 and NGC 1566.
- 2507.01355v1: The birth of young radio jets in changing-look AGN: a population study
Our population study of CLAGN was motivated by individual CLAGN that were well studied in multiple wavelengths. The interesting behavior seen in these CLAGN prompted us to pose three main questions in Section I about the properties of CLAGN at a population level. We found that the vast majority of our CLAGN sample were radio point sources and more than half of our sample were radio-loud, with a fraction of roughly 21 % 21\% of the sample having high radio loudness ratios ( R > 100 R>100 ). This implies that CLAGN radio emission is coming from the base of the compact jet close to the SMBH (rather than the X-ray emitting corona) for these objects. Through our multi-wavelength population study of 474 optically and spectroscopically-selected CLAGN, and comparing this sample to a RQ to RL AGN and to a control AGN sample, we present our answers to the three questions presented in the Introduction.
- 2609.21337v1: A large overdensity of LRD-like galaxies discovered by JWST in the SPT2349-56 protocluster at z=4.30
Our analysis of the NIRCam imaging shows that many of the red sources fulfill the color selection of widely studied LRDs, but typically have somewhat more extended morphologies with no embedded point source emission (Figs. 1–3). One source “ERD5” does nominally satisfy the strict LRD compactness cut. It is notable that while these new sources in SPT2349 − - 56 are mostly not LRDs, they are still dramatically more compact than the SMGs in SPT2349 − - 56, which generally appear distinct in Color-C 444 (Fig. 2) – SMGs appear visually enormous compared to the ERDs in Fig. 1; they are large galaxies even normalized by their stellar mass. The ERDs have a median C 444 of 0.33 ± \pm 0.12, versus the similarly red SMGs with median C 444 of 0.22 ± \pm 0.11. In fact all SMGs in SPT2349 − - 56 (including those bluer in 200-444 color) have a similarly large median C 444 of 0.21 ± \pm 0.13.
- 2609.21337v1: A large overdensity of LRD-like galaxies discovered by JWST in the SPT2349-56 protocluster at z=4.30
While none of these objects are yet spectroscopically confirmed, owing to their extremely red colors, along with the small ∼ \sim 300 arcsec 2 region in which they are found, they represent an overdensity of ∼ 2,000 × \sim 2,000\times the ERD field density, found to be 0.06 arcmin -2 by [ 24 ] to a similar depth in F444W. Five of the brightest and most compact of these ERDs are actually concentrated within a 30 arcsec 2 subregion in the north-eastern quadrant of the protocluster core (10,000 × \times overdense). The ERDs are thus highly unlikely to lie in projection in the protocluster field by chance. Including the population of 14 similarly red SMGs in the protocluster (for a sample of 25 ultra-red ERD sources in the same 300 arcsec 2 region), an overdensity of ∼ 5000 × \sim 5000\times the ERD field density is found for the protocluster core as a whole.
- 2508.08460v1: MAGAZ3NE: Far-IR and Radio Insights into the Nature and Properties of Ultramassive Galaxies at $z\gtrsim3$
In order to explore the effect of adopting different dust attenuation laws in fitting the UV-to-radio SED, we compared the results of the Calzetti et al. [13] model with those of the Charlot & Fall [18] model. For the dusty 209435, the Charlot & Fall [18] attenuation model resulted in an estimate of stellar mass 0.5 dex higher than that obtained with the starburst Calzetti et al. [13] model. In contrast, for the less dusty 195616, the difference in stellar properties was negligible. This comparison highlights the importance of the choice of dust attenuation model on the stellar mass estimate in the case of dusty galaxies. We defer a full investigation of this point to future work with a larger sample of UMGs.
- 2508.08460v1: MAGAZ3NE: Far-IR and Radio Insights into the Nature and Properties of Ultramassive Galaxies at $z\gtrsim3$
However, in the case of 209435 (right panel in Figure 4 ), the various methods result in notable differences in the SM and SFR estimates. The spectroscopic redshift ( z spec = 2.48 z_{\rm spec}=2.48 ) differs significantly from the photometric estimate ( z phot = 3.76 z_{\rm phot}=3.76 ), and this result in significant differences in the FAST + + ++ SM and SFR estimates derived from the UV-to-NIR photometry (columns 2 and 3 of Table 3 ; open gray and black triangles in the right panel of Figure 4 ), and in the CIGALE SM and SFR estimates derived from the UV-to-NIR and UV-to-radio photometry (columns 4 and 5 of Table 3 ; open and filled red hexagons in the right panel of Figure 4 ). Focusing on the four SM estimates first, we note that while the differences among them are larger than those for 195616, the largest contributing factor is caused by the offset between the photometric and spectroscopic redshift. When adopting only the spectroscopic redshift, the estimates of SM from the different photometry/fitting codes are in agreement within 0.3 dex (columns 3-5). The story becomes more interesting when we turn to the SFR. Analysis of the UV-to-NIR photometry suggests that 209435 is forming stars at a very low rate of less than 14 M ⊙ M_{\odot} yr -1 , implying that the galaxy is in the final stages of shutting down star formation (see columns 2–4 in Table 3 ). However, the CIGALE estimate of SFR derived from the full UV-to-radio SED (column 5) paints a much different picture, revealing that 209435 is actually undergoing intense star formation at a rate of 389.1 ± 83.4 389.1\pm 83.4 M ⊙ M_{\odot} yr -1 with heavy dust obscuration ( A V = 2.92 ± 0.19 A_{V}=2.92\pm 0.19 ). The dust-to-stellar mass ratio of 209435 ( M dust / M ⋆ M_{\rm dust}/M_{\star} = 10 -1.7 ) is slightly elevated compared to typical main-sequence galaxies at the similar mass and redshift ( M dust / M ⋆ ∼ 10 − 2 M_{\rm dust}/M_{\star}\sim 10^{-2} ; Scoville et al. 73 , Tacconi et al. 78 ), further supporting its classification as a DSFG.
- 2508.09749v1: A dual AGN at z = 5.4 associated with a Lyman-alpha Nebula in the Center of a Cosmic Filament
In summary, we present the discovery of a spectroscopically confirmed dual AGN at z ∼ 5.4 z\sim 5.4 with a projected separation of ∼ 10.4 \sim 10.4 pkpc, among the highest-redshift examples known. The system is embedded in a prominent overdensity, likely marking the core of a protocluster or a node of a filamentary structure. Both nuclei show clear AGN signatures from SED fitting, emission-line diagnostics, and the detection of high-ionization lines. VLT/MUSE data reveal an extended Ly α \alpha nebula exceeding 22 22 kpc, consistent with AGN-driven photoionization or shocks, and indicative of substantial circumgalactic gas reservoirs.
- 2508.09749v1: A dual AGN at z = 5.4 associated with a Lyman-alpha Nebula in the Center of a Cosmic Filament
Different star formation histories (SFHs) can significantly impact the inferred stellar mass and SFR for the measured systems ( Furtak et al., 2021 ; Tacchella et al., 2022 ; Harvey et al., 2025 ; Wang et al., 2024 ) . We present results from our fiducial parametric SFH model - the log-normal SFH - and one non-parametric SFH, the continuity model Leja et al. (2019a) . These models are widely accepted and have been utilized in various works ( Carnall et al., 2023 ; Endsley et al., 2023 ; Tacchella et al., 2023 ; Whitler et al., 2023 ; Looser et al., 2023 , e.g.,) . The redshift is fixed to the spectroscopic redshift.
- 2603.22425v1: A large population of over-massive black hole quasars at z=0.3-0.8 revealed by eROSITA
A main result of this work, the abundance of the OMBH population, is presented in the upper panel of Figure 14 . The systematic survey defining our parent sample allows quantifying the cosmic occurrence rate of these systems, which is at least 8 8 per 0.5 Gpc − 3 0.5\,\mathrm{Gpc}^{-3} (purple point in the top panel of Figure 14 ), adopting the cosmological volume to redshift 1 of the eROSITA eFEDS survey. This space density is higher than the results of Li et al. (2021a) , who found 10 over-massive systems in the approximately 1200 deg 2 HSC-WIDE survey in the z = 0.2 − 0.8 z=0.2-0.8 redshift interval ( ≈ 4 Gpc − 3 \approx 4\,\mathrm{Gpc}^{-3} ; 4 σ \sigma significance by a score ratio test ( Gu et al., 2008 ) ). For comparison at similar stellar masses, we consider the EIGER JWST follow-up ( Yue et al., 2024 ; Stone et al., 2024 ) of 6 z ∼ 6 z\sim 6 quasars with optical magnitudes of m 1450 Å < 24.4 mag AB m_{\mathrm{1450\AA}}<24.4\mathrm{mag\ AB} . The space density of such luminous quasars is 3 Gpc − 3 3\,\mathrm{Gpc}^{-3} ( Willott et al., 2010 ) , and they find half of their follow-up sample (3/6) to be over-massive above M ∙ / M ⋆ > 5 % M_{\bullet}/M_{\star}>5\% . While the space densities are uncertain, currently we infer a 96 times higher space density (14 σ \sigma significance with the same test) of OMBHs: 3/(0.5 Gpc 3 \mathrm{Gpc}^{3} ) vs. (3/6)/(3 Gpc 3 \mathrm{Gpc}^{3} ). Our eight sources allow us to put a conservative, 3 σ \sigma lower limit on the space density of > 4.2 Gpc − 3 >4.2\,\mathrm{Gpc}^{-3} ( Barker, 2002 , Jeffrey-Poisson rate estimate) . Considering the scatter in single-epoch masses halves the number density and loosens threshold to M ∙ / M ⋆ > 2 % M_{\bullet}/M_{\star}>2\% ( section 4.2 ), where the final estimate is 8 Gpc − 3 8\,\mathrm{Gpc}^{-3} with a 3 σ \sigma lower limit of 2.1 Gpc − 3 2.1\,\mathrm{Gpc}^{-3} . The estimates are listed in Table 2 .
- 2603.22425v1: A large population of over-massive black hole quasars at z=0.3-0.8 revealed by eROSITA
We present a survey that revealed eight OMBHs with M ∙ / M ⋆ > 5 % M_{\bullet}/M_{\star}>5\% , ten times higher black hole masses than the typical ratio in elliptical galaxies. Compared to other studies, these black holes stand out:
- 2610.20709v1: How Little Red Dots Turn Blue: Evolution of Kelvin-Helmholtz Contracting Black Hole Envelopes and Observational Diagnostics
We use a time-dependent model of an optically thick gaseous envelope surrounding a massive BH, in which radiative cooling, declining ISM inflow, BH accretion, and accretion-powered feedback are coupled, and translate the resulting evolution into mock SEDs including a coevolving nuclear stellar population. Our main conclusions are as follows.
- 2610.20709v1: How Little Red Dots Turn Blue: Evolution of Kelvin-Helmholtz Contracting Black Hole Envelopes and Observational Diagnostics
Kelvin–Helmholtz contraction of a gas-fed BHE can naturally transform an LRD into an LBD through an observable transitional phase. Sustained inflow initially builds a cool, extended envelope whose photospheric temperature is regulated near the Hayashi track. As supernova feedback reduces the gas supply, the envelope can no longer be replenished and begins to contract. Its photosphere shrinks and heats until the accretion disk emerges, producing a continuous sequence from an LRD to a transitional source and finally to an LBD. The proposed AGN HR diagram provides a complementary view of this sequence, connecting a Hayashi-track-regulated BHE to an exposed accretion disk through envelope contraction.
Abstract
Little red dots (LRDs) are a newly discovered population that may trace rapidly growing black holes (BHs) and provide a link between seed BHs and luminous active galactic nuclei (AGNs). However, no LRD had previously been spectroscopically confirmed at $z>10$, leaving this earliest phase observationally unexplored. Using JWST/NIRSpec spectroscopy from the EMBER program, we measure a spectroscopic redshift of $z_{\rm spec}=10.361^{+0.003}_{-0.002}$ for \target, the highest-redshift LRD candidate known to date. The redshift is constrained by a prominent Ly$α$ break and multiple tentative emission lines, including C\,{\sc iv}\,$λ\lambda1549,1551$ and [O\,{\sc iii}]\,$\lambda4363$ detected at $S/N=3.9$ and $3.6$, respectively. Its extreme NIRCam-MIRI color of $m_{\rm F444W}-m_{\rm F770W}=1.82\pm0.1$, characteristic V-shaped continuum with a turnover near the Balmer limit, and continuum slopes of $β_{\rm UV}=-2.26^{+0.11}_{-0.11}$ and $β_{\rm opt}=1.17^{+0.74}_{-0.70}$ all support its LRD nature. A possible iron complex at $λ_{\rm rest}\sim0.24$--$0.25\,{\rm μm}$ and a possibly high $\log\left([{\rm O\,III]\,\lambda4363/\rm Hγ}\right)=0.17^{+0.24}_{-0.22}$ further support an AGN-like interpretation, as seen in previously known LRDs. Tentative detection of Ly$α$ emission may indicate enhanced Ly$α$ transmission at $z\sim10$. Our findings extend the observational frontier of BH growth into the seed-BH formation era, and upcoming MIRI spectroscopy will further establish the physical nature of the source.
Discussion
Discussion access requires a security token. Register for the weekly digest.