2611.06026v1 · First listed 2026-11-05
Spectroscopy-informed Deep Learning Searches for Photometric Little Red Dots in JWST Surveys
A two-stage, spectroscopy-informed NIRCam classifier finds LRD candidates beyond standard color selections. Held-out recall/precision are 0.92/0.79, while broad Hα in 10 of 13 grating-observed candidates supports—without confirming—the LRD interpretation of many new selections. [9][10]
Evidence
The authors align matched NIRCam-image and NIRSpec/PRISM-spectrum embeddings, then freeze the encoders and train an image-only classification head; inference thus needs NIRCam alone. The stratified training/validation split contains 6,079/1,462 objects, including 102/25 labeled LRDs; augmentations perturb images and spectra to address photometric noise, filter incompleteness, and spectral variation. The full training set is described as 127 spectroscopically confirmed LRDs plus ~7,500 literature-labeled non-LRDs. At p=0.80, held-out recall is 0.92 and precision 0.79. Among 35 candidates previously labeled non-LRDs, 10/13 with usable grating Hα show broad components (FWHM ≈1,100–3,500 km s−1), an independent but incomplete diagnostic. [2][9][10]
Earlier work
Color criteria have produced non-identical LRD samples. As a concrete spectroscopic comparison, RUBIES reports broad Balmer detections in upwards of 80% of V-shaped-continuum sources, with remaining cases chiefly inconclusive from data limitations. The 10/13 (77%) broad-Hα fraction here is numerically similar, but its small, classifier-selected grating subset and different selection prevent a completeness or population-equivalence claim. [1][12][10]
What changes
Rather than applying colors directly, this work transfers spectroscopic information into imaging representations. It reports 35 spectroscopic-sample candidates, 357 from Dawn JWST Archive imaging, and 23 from two further surveys. Candidates span broader observed SED properties than existing samples, which the authors interpret as possible evidence that color selection misses diversity. Recovery of one reported candidate in each of SAPPHIRES and BEACON supports cross-survey applicability, not a measured recovery fraction. [1][4]
Limits and open questions
The positive class comprises only a few hundred available confirmed LRDs, while brown-dwarf and quiescent-galaxy contaminant labels are also limited. Genuine LRDs likely remain labeled as ordinary galaxies, biasing the decision boundary and making reported precision uncertain. Survey depth, filters, extraction, and reductions affect inputs; some candidates lack valid photometric redshifts or complete photometry. Candidate totals must not be read as completeness because a survey-specific known-LRD census and input/quality-selection accounting are absent. [8][5][4]
Based on supplied abstract and selected HTML excerpts plus captions, not a complete paper extraction. No threshold sweep, calibration uncertainty, full confusion-matrix counts, or candidate-by-candidate selection details were supplied.
Key figures
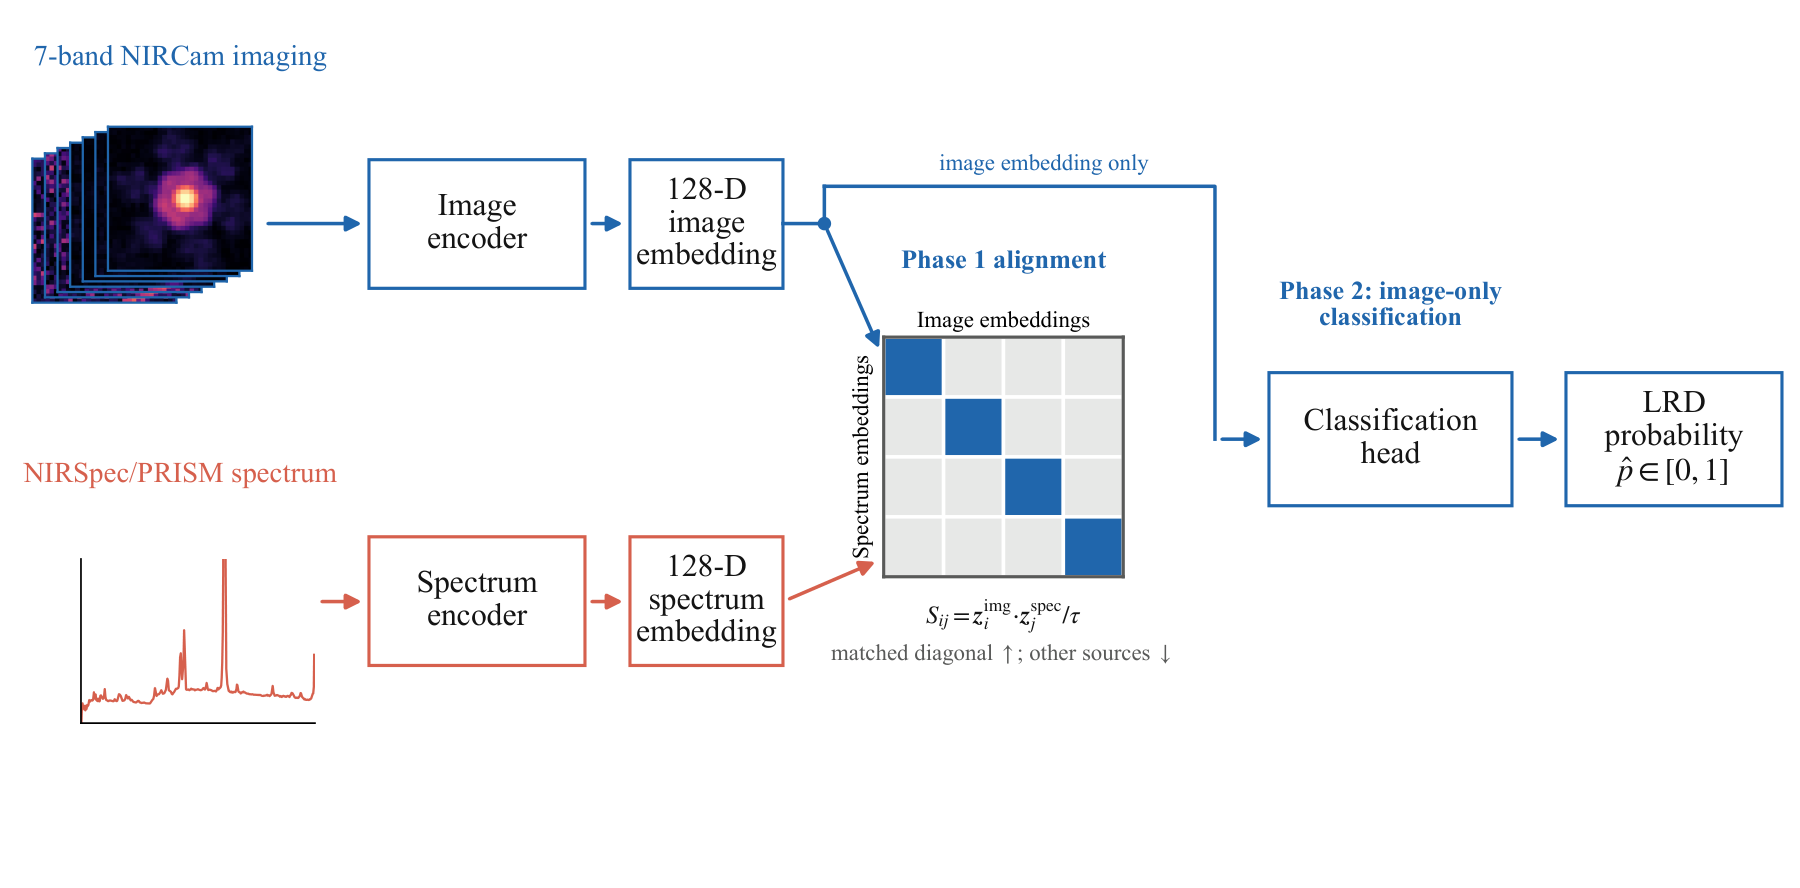
Tests the methodological premise: PRISM spectral and NIRCam image embeddings are contrastively aligned before an image-only head is trained, so spectroscopy informs training rather than inference.
Original caption
Figure 1: Cross-modal LRD classification framework. Phase 1 aligns paired NIRCam image and NIRSpec/PRISM spectrum embeddings in a shared space using a bidirectional InfoNCE objective. In Phase 2, the encoders are frozen, and only an image-based classification head is trained. Inference requires only NIRCam imaging.
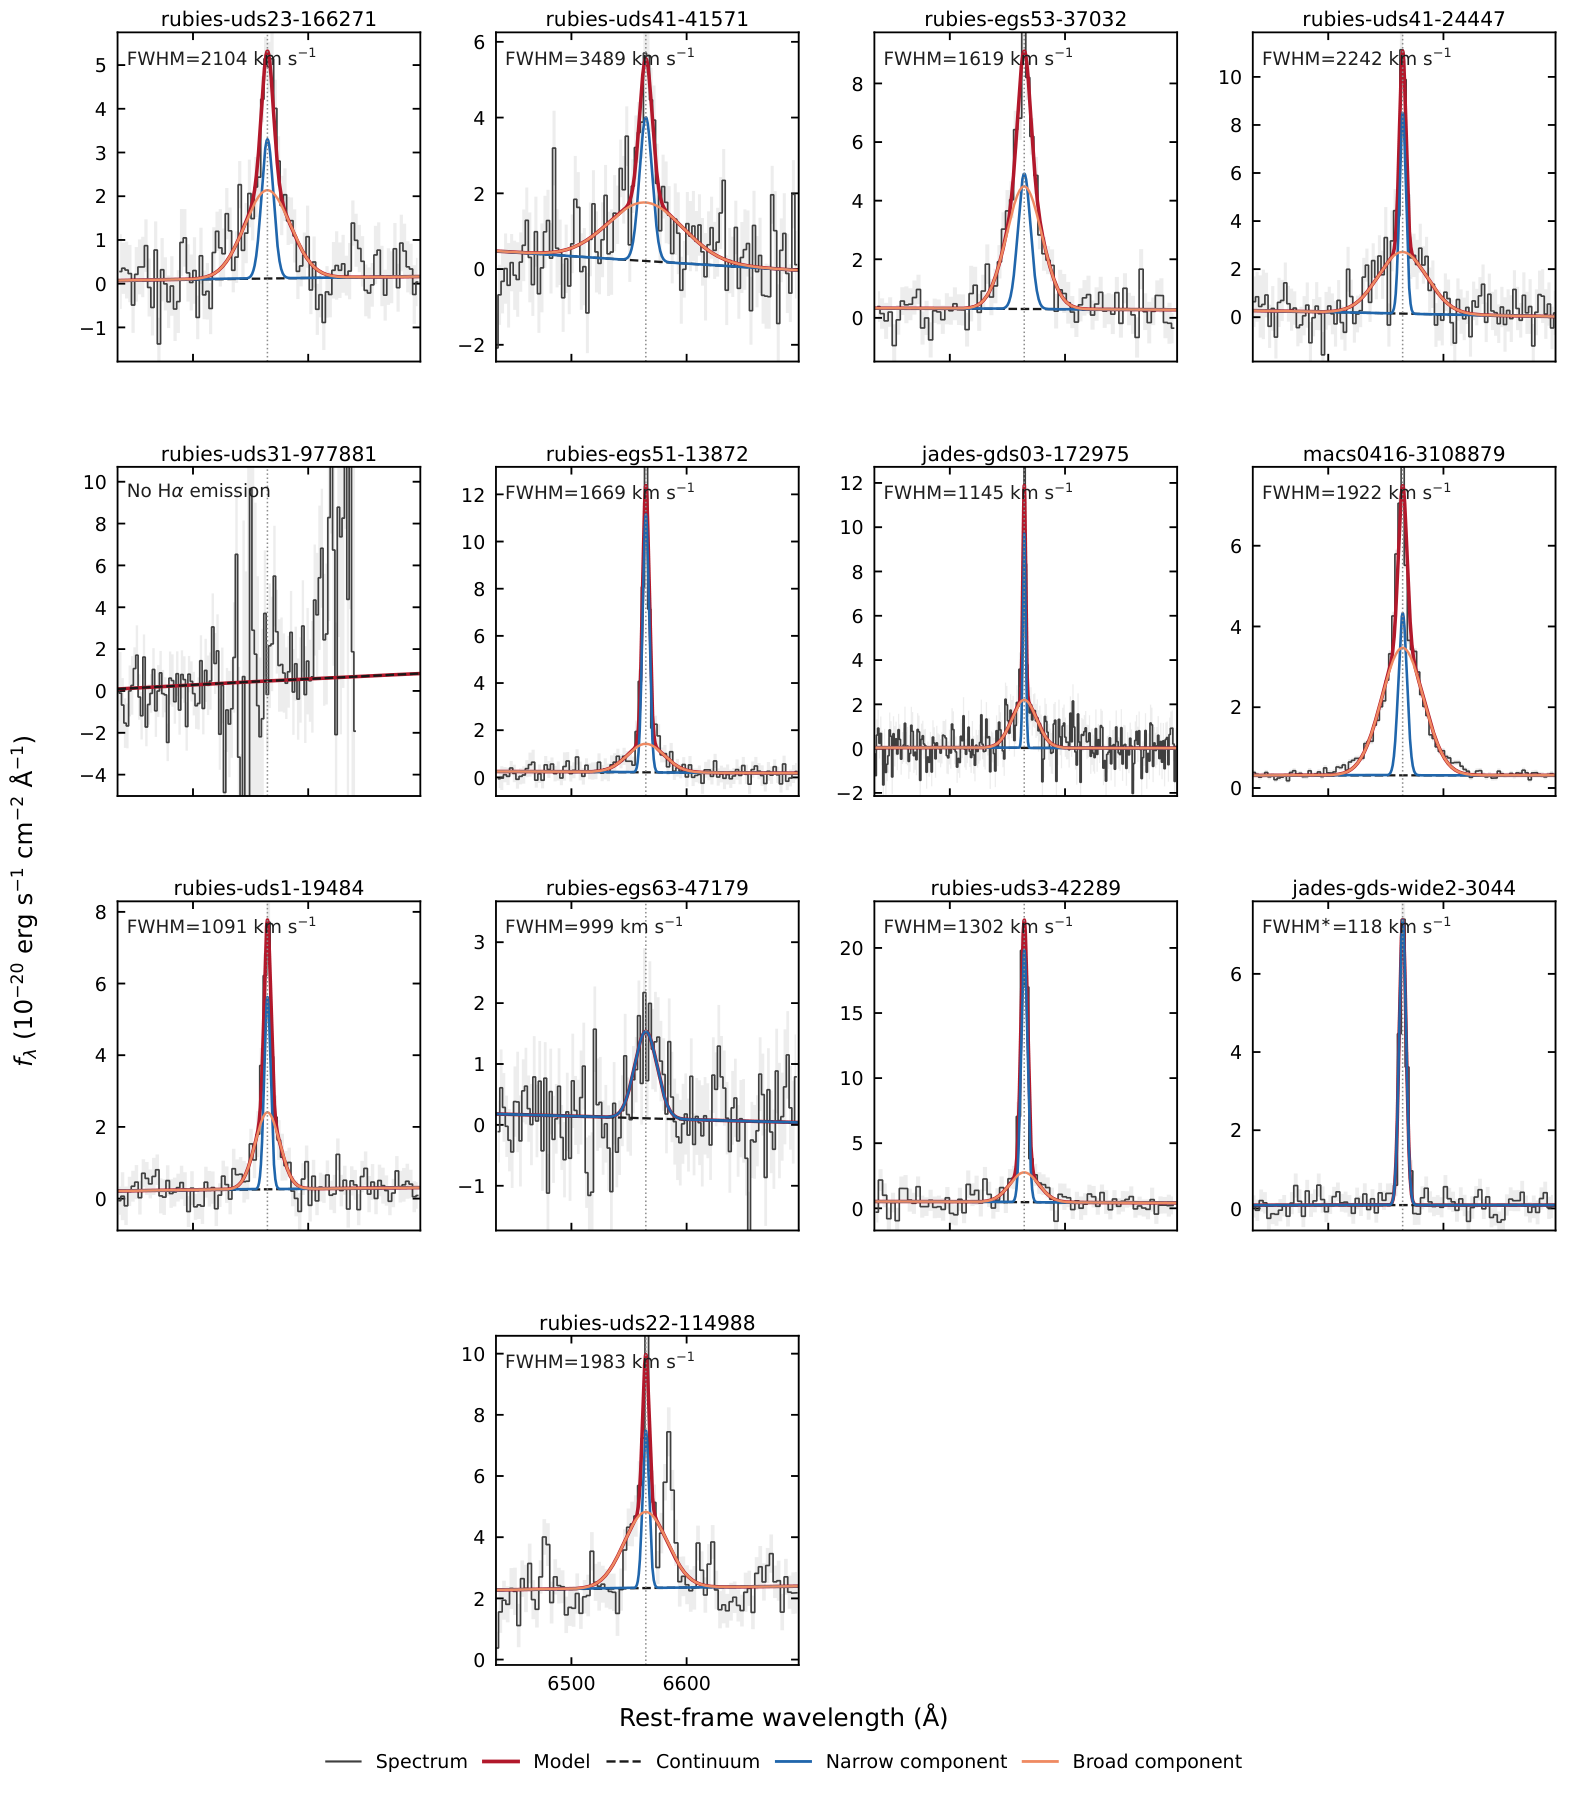
Tests spectroscopic support for model-selected candidates by fitting Hα with minimum-BIC continuum-plus one- or two-Gaussian models; displayed 1σ spectral uncertainties and broad-component widths show the basis for the broad-line classification.
Original caption
Figure 5: H α \alpha fits for 13 candidates. Black line and gray shadow show the spectra and 1 σ 1\sigma uncertainties. Red curves are the minimum-BIC models; dashed black curves are the continua, and blue and orange curves are the narrow and broad components added to the continuum. Labels give the intrinsic FWHM of the broad component for two-Gaussian models or of the line for single-Gaussian models; the asterisk marks the narrow-component width of jades-gds-wide2-3044.
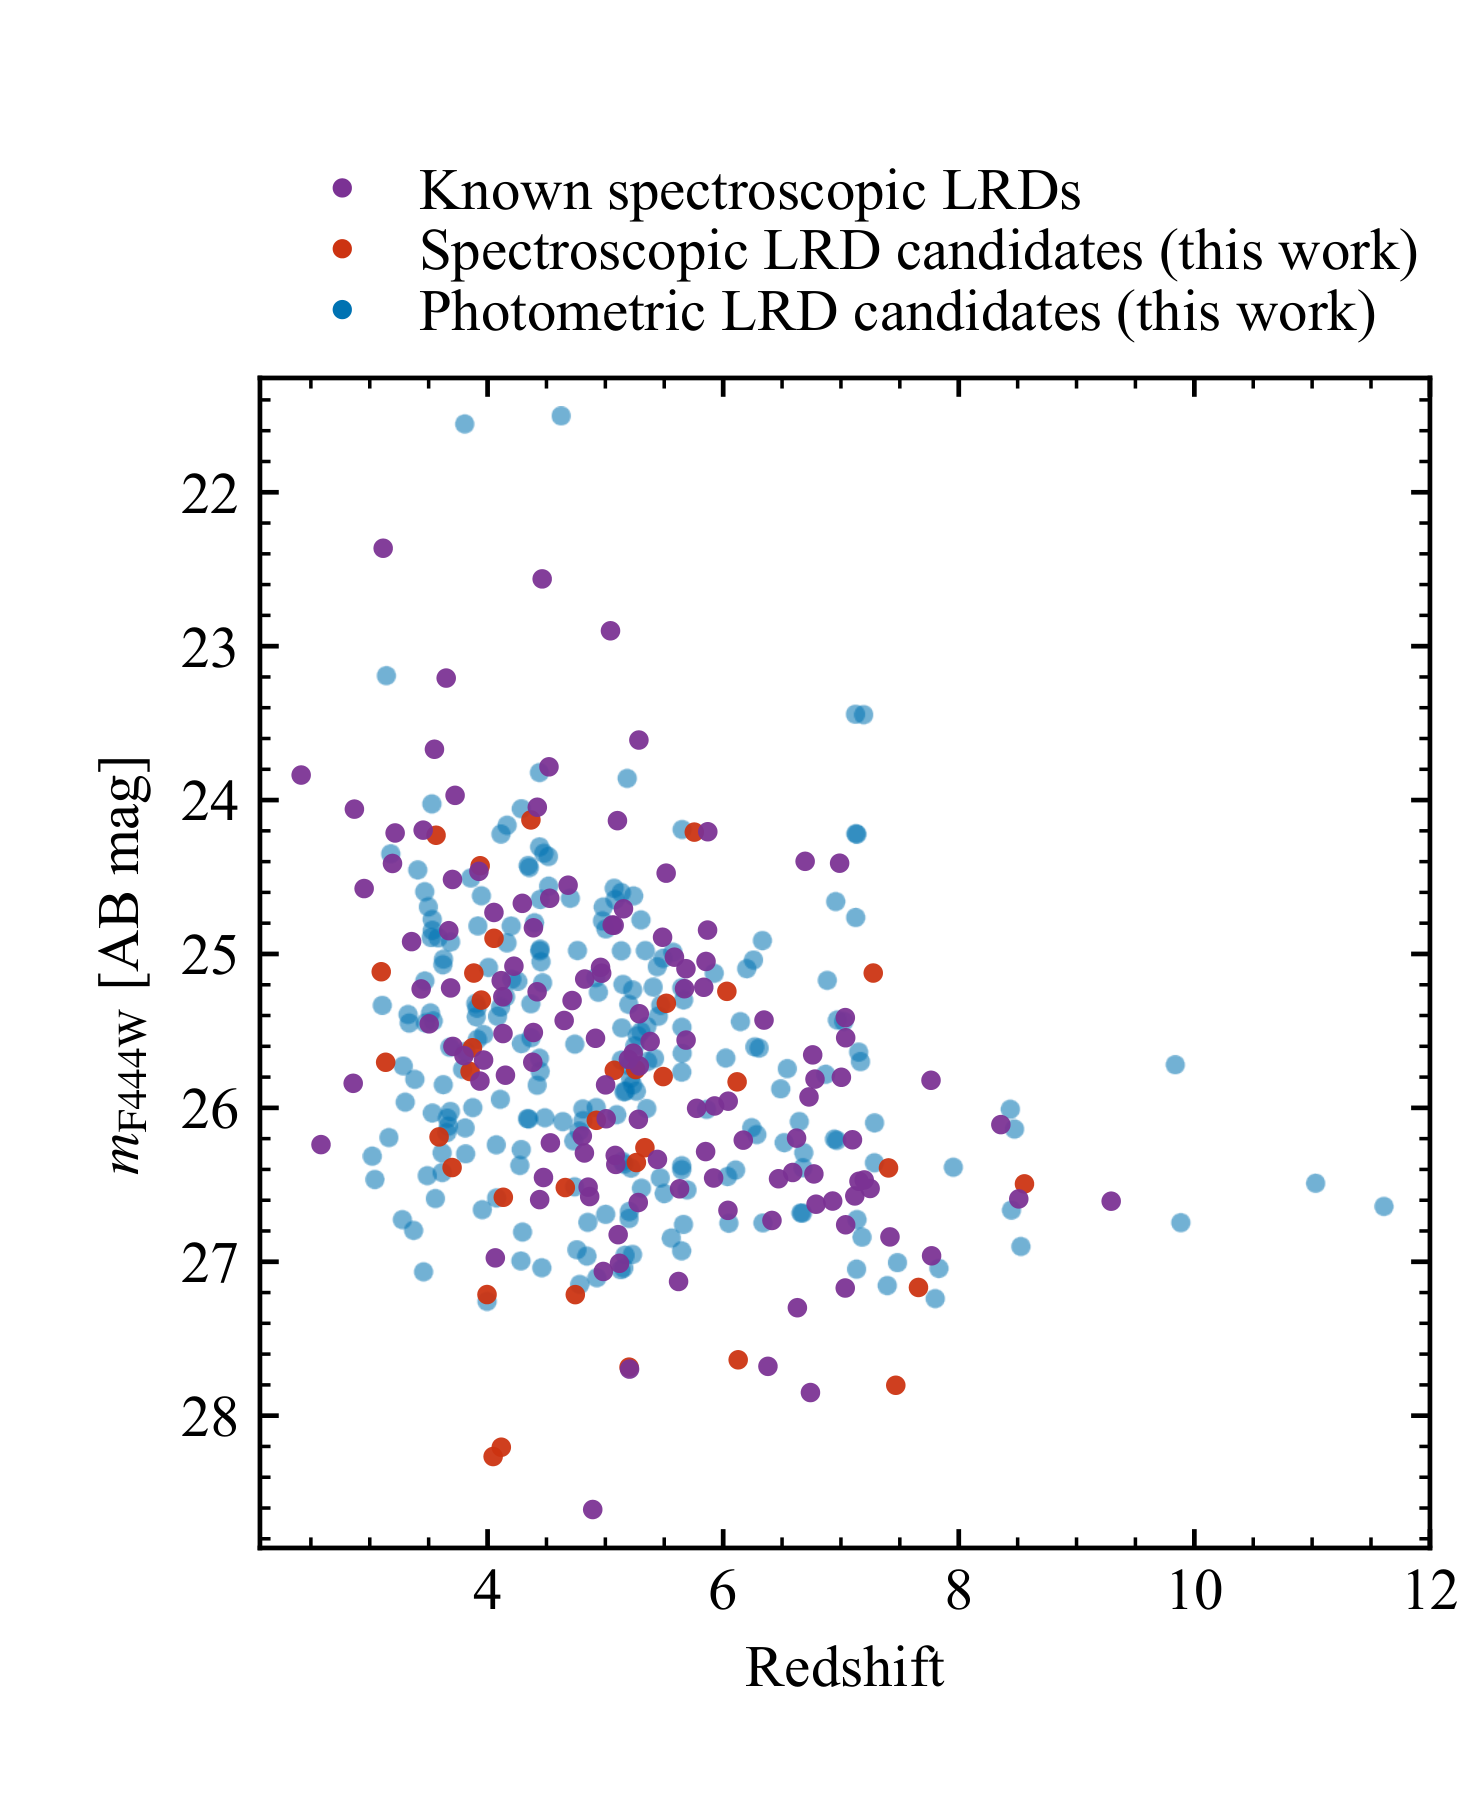
Tests whether selected candidates occupy the observed F444W-magnitude–redshift region of known spectroscopic LRDs; it mixes spectroscopic redshifts where available with photometric redshifts otherwise.
Original caption
Figure 7: F444W AB magnitude versus redshift for known spectroscopic LRDs and model-selected candidates. Spectroscopic redshifts are used where available and photometric redshifts otherwise.
Related research
Previous digest
Zhang, Zhang, and Wu train a cross-modal classifier that aligns JWST/NIRCam images with matched NIRSpec/PRISM spectra, then identifies little red dots from imaging alone. Applied to spectroscopically observed high-redshift galaxies previously labeled non-LRDs, it finds 35 new candidates; 10 of the 13 with medium- or high-resolution grating spectra show broad Hα, providing a direct hallmark of the population. The same model recovers 357 candidates in Dawn JWST Archive imaging and 23 more in the independent SAPPHIRES and BEACON surveys. By extending into a broader range of observed colors and continuum slopes than conventional samples, the work argues that fixed color cuts miss part of the LRD-like population and offers a scalable spectroscopy-informed route to more homogeneous searches.
Sources and evidence (26)
- 2611.06026v1: Spectroscopy-informed Deep Learning Searches for Photometric Little Red Dots in JWST Surveys
Little Red Dots (LRDs) are a population of compact, red sources discovered at high redshift with JWST that exhibit distinctive V-shaped spectral energy distributions (SEDs). Existing LRD samples are typically identified using a variety of color-based selection criteria, which can lead to differences in the populations recovered by different studies. We develop a cross-modal machine-learning framework that combines matched NIRCam imaging and NIRSpec/PRISM spectroscopy to transfer spectroscopic information into imaging-based representations, enabling LRD identification from JWST/NIRCam imaging alone. Applied to spectroscopically observed high-redshift galaxies previously classified as non-LRDs, our model identifies 35 new LRD candidates. The majority satisfy at least one independent LRD color selection criterion, and among the 13 candidates with medium- or high-resolution NIRSpec grating spectra, 10 exhibit broad H$α$ emission - a hallmark of LRDs. We further apply the classifier to public NIRCam imaging from the Dawn JWST Archive and two independent JWST surveys, yielding 357 and 23 additional LRD candidates, respectively. The candidates recovered by our method span a broader range of observed SED properties than those in existing samples, suggesting that current color-selected samples may not fully capture the diversity of LRD-like systems present in JWST surveys. Our findings highlight the value of spectroscopy-informed photometric classification as a powerful strategy for systematically mining large-area JWST imaging datasets and provide a practical framework for future studies of this emerging population.
- 2611.06026v1: Spectroscopy-informed Deep Learning Searches for Photometric Little Red Dots in JWST Surveys
The model is trained in two stages: cross-modal representation learning and supervised image classification. We adopted a stratified split with a target validation fraction of 20% for both the LRD and negative classes. The resulting training and validation sets contain 6,079 and 1,462 sources, including 102 and 25 labeled LRDs, respectively. Stochastic data augmentation is applied only during training. NIRCam images undergo horizontal and vertical flips, right-angle and arbitrary rotations, and cutout masking outside the central region. We additionally apply multiplicative flux perturbations, Gaussian noise, and random channel dropout to improve robustness to photometric uncertainties and incomplete filter coverage. During Phase 1, spectra are augmented with uncertainty-scaled Gaussian noise, shifts of up to one native wavelength bin, and masking of 8-24 consecutive bins.
- 2611.06026v1: Spectroscopy-informed Deep Learning Searches for Photometric Little Red Dots in JWST Surveys
The paper is organized as follows. In Sections II and III , we describe the training sample and the observational data used in this work. In Section IV , we present the network architecture and training procedure. In Section V , we evaluate the classifier performance and present the resulting LRD candidate samples. In Section VI , we present the various properties of the newly identified LRDs and discuss the possible limitations. Finally, in Section VII , we summarize our main results.
- 2611.06026v1: Spectroscopy-informed Deep Learning Searches for Photometric Little Red Dots in JWST Surveys
The applications to SAPPHIRES and BEACON yield plausible LRD candidates under substantially different observing conditions and independently recover one previously reported candidate in each survey. These results demonstrate the practical applicability and transferability of the selection pipeline across diverse JWST imaging datasets. However, the recovered candidates and their numbers should not be interpreted as measures of classification completeness. A meaningful recovery fraction would require a complete census of previously known LRDs in each survey, together with an assessment of which sources satisfy the classifier’s input and quality-selection requirements.
- 2611.06026v1: Spectroscopy-informed Deep Learning Searches for Photometric Little Red Dots in JWST Surveys
Recovering previously reported candidates, along with identifying new sources, shows that the classifier can be effectively applied to additional JWST datasets beyond those used for training. The selected candidates exhibit photometric and morphological properties broadly consistent with those of known LRDs. This provides a useful consistency check, although survey-dependent selection effects may also contribute to the observed similarities. At the same time, variations in survey depth, filter coverage, source extraction, and data reduction procedures can affect the quality and interpretation of the input images. Consequently, survey-specific input validation and visual inspection remain important components of the candidate selection process. Owing to data limitations, not all the newly identified LRD candidates possess valid photometric redshifts or complete photometric measurements. We therefore restrict our analysis to those sources for which all relevant measurements are available below.
- 2611.06026v1: Spectroscopy-informed Deep Learning Searches for Photometric Little Red Dots in JWST Surveys
Figure 7 compares the redshift and observed F444W magnitude distributions of spectroscopically confirmed LRDs and the candidates identified through the spectroscopic, DJA, SAPPHIRES, and BEACON searches. The newly identified candidates occupy broadly the same region of the z z – m F444W m_{\rm F444W} parameter space as the confirmed LRD population, indicating that the classifier is recovering sources with observational properties consistent with known LRDs.
- 2611.06026v1: Spectroscopy-informed Deep Learning Searches for Photometric Little Red Dots in JWST Surveys
Figure 7: F444W AB magnitude versus redshift for known spectroscopic LRDs and model-selected candidates. Spectroscopic redshifts are used where available and photometric redshifts otherwise.
- 2611.06026v1: Spectroscopy-informed Deep Learning Searches for Photometric Little Red Dots in JWST Surveys
Despite its promising performance, several limitations should be considered when interpreting the results of this work. First, the training sample remains relatively small and potentially incomplete. The positive class is constructed from currently available spectroscopically confirmed LRDs, which number only a few hundred objects and may not fully capture the diversity of the underlying population. Similarly, the numbers of spectroscopically confirmed brown dwarfs and high-redshift quiescent galaxies available for training are also limited, restricting the model’s ability to learn the full range of properties exhibited by these potentially important contaminants. Moreover, as demonstrated by the spectroscopic candidates identified in this work, some genuine LRDs are likely still labeled as ordinary high-redshift galaxies in existing catalogs. Such label incompleteness introduces uncertainty into both the training process and the evaluation metrics, potentially biasing the learned decision boundary and causing the reported precision to underestimate the true performance of the classifier. As larger and more representative spectroscopic samples become available, retraining with improved labels will not only enhance model robustness and reduce selection biases, but will also enable a more complete exploration of the diversity of the LRD population and its principal contaminants.
- 2611.06026v1: Spectroscopy-informed Deep Learning Searches for Photometric Little Red Dots in JWST Surveys
In this work, we develop a spectroscopy-informed deep-learning framework for identifying Little Red Dots from JWST imaging data, trained on 127 spectroscopically confirmed LRDs and ∼ 7,500 \sim 7,500 literature-labeled non-LRD sources. By aligning NIRCam images and NIRSpec/PRISM spectra during training, the model learns spectroscopically informed image representations while requiring only NIRCam imaging at inference. On a held-out validation sample, it achieves a recall of 0.92 and a precision of 0.79 at p = 0.80 p=0.80 , demonstrating that imaging data alone can recover the majority of currently known LRDs.
- 2611.06026v1: Spectroscopy-informed Deep Learning Searches for Photometric Little Red Dots in JWST Surveys
The classifier identifies 35 LRD candidates among spectroscopically observed high-redshift galaxies that were previously labeled as non-LRDs. Many of these sources exhibit independent characteristics commonly associated with LRDs. Among the 13 candidates with usable medium- or high-resolution H α \alpha spectroscopy, 10 show a broad H α \alpha component with FWHM values of approximately 1100 − 3500 km s − 1 1100-3500\ \mathrm{km\ s^{-1}} . In addition, most candidates display compact red NIRCam morphologies and pronounced V-shaped PRISM continua. These results provide independent support for the LRD interpretation of many model-selected candidates and suggest that a significant fraction of the apparent false positives may correspond to previously uncatalogued members of the LRD population.
- 2506.05459v1: RUBIES: A Spectroscopic Census of Little Red Dots; All V-Shaped Point Sources Have Broad Lines
We present one of the largest spectroscopic samples of broad Balmer line sources at high redshift to date, including 80 robust detections at z > 3.1 z>3.1 , 28 (35%) of which lie at z > 6 z>6 . Our detections are enabled by the unite package, which combines multiple NIRSpec spectra, i.e. the PRISM and G395M spectra, simultaneously to model emission lines and continua. This approach leverages the signal-to-noise of the PRISM and the resolution of G395M to identify kinematic components of emission lines, overcoming limitations of single-disperser analyses.
- 2506.05459v1: RUBIES: A Spectroscopic Census of Little Red Dots; All V-Shaped Point Sources Have Broad Lines
The majority of sources with (spectroscopic) v-shaped continua also show a dominant point source component at rest-optical wavelengths. Remarkably, we robustly detect broad Balmer emission lines for upwards of 80% of these sources, with the remainder being inconclusive primarily due to data shortcomings. Similarly, the majority of sources with v-shaped continua show broad Balmer emission lines. Of this population, 80% also show a prominent point-source component in rest-optical imaging.
- 2512.15853v1: From "The Cliff" to "Virgil": Mapping the Spectral Diversity of Little Red Dots with JWST/NIRSpec
The fraction of broad-line AGNs (BLAGNs) satisfying the LRD photometric selection is high, ranging from ∼ \sim 58–92% across different fields. This fraction increases with a more inclusive selection that extends to bluer optical slopes.
- 2512.15853v1: From "The Cliff" to "Virgil": Mapping the Spectral Diversity of Little Red Dots with JWST/NIRSpec
Among photometric LRDs with NIRSpec grating spectra at 3.5 < z < 6.8 3.5<z<6.8 , ∼ \sim 50–70% exhibit broad emission lines. These represent lower limits, as nearly all show clear emission lines, and the identification of broad components is limited by depth and sensitivity.
- 2607.22835v1: Unsupervised selection and characterisation of Little Red Dots in JWST surveys with manifold learning
A central point for interpreting our results is that the parent sample is itself the product of a selection function, and we quantify its effect on the spectroscopic LRDs explicitly. Of the 116 unique spectroscopically selected LRDs of de Graaff et al. (2025) , 89 ( 77 % 77\% ) fall within the footprint and detection limits of our parent catalogue. Of these, 68 ( 59 % 59\% of the original 116) additionally satisfy the pre-processing requirements above and enter the final sample. The losses are not random in redshift: the sources removed by pre-processing have a higher median redshift ( z ≃ 5.6 z\simeq 5.6 ) than those retained ( z ≃ 5.1 z\simeq 5.1 ). Waiving the detection requirement in F814W, i.e., allowing it to be undetected (Section 2.3 ), already recovers the most common dropout cases, but a detection is still required in the bluer NIRCam bands, so the very reddest and highest-redshift sources (faint or absent in F115W and F150W) continue to be preferentially removed; this residual imprint of the detection requirement on the high-redshift tail is the dominant bias of the parent selection.
- 2607.22835v1: Unsupervised selection and characterisation of Little Red Dots in JWST surveys with manifold learning
The structure is intrinsic, not a projection artefact (Section 4.2 ). The same localisation is present in the original feature space, and a cross-validated classifier recovers ∼ \sim 90% of held-out spectroscopic LRDs, confirming that the location generalises.
- 2604.16178v1: Euclid: Scaled-up little red dots and other sources with v-shaped spectral energy distributions at z>4
After cross-matching with existing AGN catalogues and considering the SED-fitting results with CIGALE , we find that (at least) 9.4% of the V-shaped-SED selected sources at z > 4 z>4 could host an AGN. However, interestingly, most of the classically selected AGN via X-ray surveys and bright 24 µ m 24\,\rm$\mathrm{\SIUnitSymbolMicro m}$ sources at z > 4 z>4 do not comply with the double power-law SED criteria, but rather constitute a disjoint population. This is consistent with the fact that LRDs are X-ray weak, and that in general most AGN do not have colours or β \beta values consistent with LRDs.
- 2604.16178v1: Euclid: Scaled-up little red dots and other sources with v-shaped spectral energy distributions at z>4
We have studied the properties of a population of Euclid /IRAC-selected, V-shaped-SED galaxies at z > 4 z>4 in ∼ 0.75 deg 2 \sim 0.75\,\rm deg^{2} of the COSMOS field. Our sample contains a total of 16 and 233 sources, for two different cuts in the rest-frame optical SED power-law slopes, namely β red > 0 \beta_{\rm red}>0 and β red > − 1 \beta_{\rm red}>-1 , respectively. Out of these sources, a total of 16 satisfy also having a compactness 1 σ 1\sigma above the median compactness of all z > 4 z>4 galaxies, as defined from their Euclid H E H_{\scriptscriptstyle\rm E} -band images. We consider these 16 sources to be the most robust Euclid LRD/LBD candidates. We note that imposing compactness on the H E H_{\scriptscriptstyle\rm E} band is stricter than imposing it at longer wavelengths, as compactness typically increases with wavelength, so our selection is very conservative.
- 2609.11879v1: Learning JWST. I. A Foundation Model for New Population Discoveries and Morphology-Aware Photometric Redshift Measurements in the JADES Survey
We randomly initialize the model and train from scratch for 20 epochs. We use AdamW optimizer [ 46 ] with a constant learning rate of 3 × 10 − 4 3\times 10^{-4} . The batch size is B = 256 B=256 . The training loss decreases steadily before epoch 10 and then gradually flattens. The reconstruction loss contributes about 80% of the total loss.
- 2609.11879v1: Learning JWST. I. A Foundation Model for New Population Discoveries and Morphology-Aware Photometric Redshift Measurements in the JADES Survey
The same representation enables efficient generalization from discovered populations to new candidates. Using only 19 secure broad-line LRDs as seeds, a rkNN search identifies 113 candidates in C02, recovering 51.4% of the photometrically selected and 80% of the spectroscopically selected LRDs. It also identifies 57 candidates that have not been reported in the literature for follow-up. Public NIRSpec/Prism spectra for five well-covered candidates show H α \alpha emission and LRD-like continuum (see Figure 8 ), illustrating how similarity search can rapidly expand rare populations.
- 2604.14551v1: Discovery of low-redshift analogues to "Little Red Dots" in DESI: A later evolutionary stage of compact LRDs?
We have conducted a systematic search for low-redshift analogues to the high-redshift LRD population within the DESI DR1 spectroscopic survey. Our search identified five objects at 0.2 < z < 0.4 0.2<z<0.4 that share the defining characteristics of the LRD. Our findings are summarized below.
- 2604.14551v1: Discovery of low-redshift analogues to "Little Red Dots" in DESI: A later evolutionary stage of compact LRDs?
Unlike high-redshift LRDs, our low-redshift analogues are unambiguously classified as AGN by BPT/VO diagnostics. This suggests they reside in more chemically mature, relatively metal-rich host galaxies.
- 2505.12719v1: Composite spectrum of Little Red Dot from a standard inner disk and an unstable outer disk
One of the most mysterious results from observations of the James Webb Space Telescope (JWST) is the detection of numerous, high-redshift, very red, extremely compact, broad-line sources termed “little red dots” (LRDs). It is unclear whether the LRDs belong to an active galactic nucleus (AGN) or simply a collection of very compact star clusters. We build spectral energy distributions (SEDs) for 29 LRDs at z ≈ 3 − 8.5 z\approx 3-8.5 based on JWST photometric and spectroscopic observations. We find that the V-shaped SEDs of these LRDs exhibit a roughly similar break frequency at ν b = 10 14.96 ± 0.06 \nu_{\rm b}=10^{14.96\pm 0.06} Hz, which corresponds to λ b = 3287 − 424 + 487 Å \lambda_{\rm b}=3287_{-424}^{+487}\mathrm{\AA} in the rest frame. We propose that this unique SED can be explained by the combination of an inner standard disk and an outer gravitationally unstable accretion disk with Toomre parameter Q ∼ 1 Q\sim 1 . The outer disk has a temperature of ∼ 2000 − 4000 \sim 2000-4000 K for typical AGN parameters, which can well reproduce the near-infrared to optical bump as observed in LRDs. This model can naturally explain the strong infrared to optical emission and the V-shaped SED with a similar break frequency ≃ 10 15 \simeq 10^{15} Hz for LRDs without invoking strong dust extinction or unusual stellar contribution from a host galaxy. Most LRDs stay in sub-Eddington state based on the SED modeling, which are intrinsically weak in X-rays.
- 2505.12719v1: Composite spectrum of Little Red Dot from a standard inner disk and an unstable outer disk
James Webb Space Telescope (JWST) is opening up a new era in the study of the early Universe, thanks to its remarkable sensitivity and angular resolution at infrared wavelength [ 1 ] . One of the most surprising results from JWST is the discovery of numerous faint, optically red and extremely compact sources ( R e ≈ 100 R_{\mathrm{e}}\approx 100 pc) [ 2 , 3 , 4 ] . These sources are referred to as “Little Red Dots” [ 5 , 6 , 7 , 3 ] , which are widely considered as candidates for high-redshift active galactic nuclei (AGNs) based on their broad emission lines, and can play an important role in understanding the evolution of galaxies and supermassive black holes at cosmic dawn [ 8 , 6 , 7 , 9 , 10 , 11 ] . The LRDs exhibit spectral energy distributions (SEDs) characterized by a “V-shaped” continuum with a luminous red component and a faint blue component in the rest-frame spectrum, which is notably different from that of local AGNs [ 5 , 7 , 3 ] . Furthermore, the LRDs are less variable and are X-ray weaker compared to classical AGNs [ 12 , 13 , 14 ] . Interpreting the LRD SEDs remains difficult, which prevents us from further understanding the possible SMBH growth or galaxy evolution in high redshift [ 15 , 16 ] . The common AGN-only or galaxy-only models cannot adequately describe the two distinct spectral components in V-shaped SEDs. For the AGN-only scenario, the red/optical component is dust-reddened AGNs due to the dust in the torus and/or interstellar medium, ( 17 , 8 , e.g.,) . It has also been proposed that the LRDs may be powered by the pure dusty starburst galaxies [ 18 , 19 , 20 , 21 ] . Alternatively, some studies also consider the co-existence of AGNs and galaxies: either a galaxy dominates the rest-frame UV SED while a reddened AGN contributes in the rest-frame infrared to optical range; or the AGN contributes significantly to the rest-frame UV while a dusty stellar population contributes in the rest-frame UV SED [ 17 , 18 , 21 ] . A fraction of LRDs exhibit a clear Balmer break in their spectra, which indicates either an old stellar population [ 22 , 23 ] or extremely dense gas surrounding an AGN [ 24 , 25 , 26 ] . Most of these models predict sign
- 2508.00057v1: Discovery of a Little Red Dot candidate at $z\gtrsim10$ in COSMOS-Web based on MIRI-NIRCam selection
The fraction of LRDs among the overall galaxy population with M UV = − 20 M_{\rm UV}=-20 reaches 2.6 − 2.1 + 5.9 % 2.6^{+5.9}_{-2.1}\% at z ∼ 10 z\sim 10 , intriguingly suggesting that an even higher LRD fraction may be expected at z > 10 z>10 (Section VI.2 ). In an extreme scenario, extrapolating the evolution of the LRD fraction based on the number density evolution of both LRDs and galaxies indicates that the LRD fraction could approach ∼ 1 \sim 1 at z ∼ 20 − 30 z\sim 20\,\mathchar 45\,30 (Figure 8 ). If this is the case, it may imply that SMBHs can become luminous more rapidly than galaxies, and that the very first M UV = − 20 M_{\rm UV}=-20 sources in the Universe may have been LRDs.
- 2508.00057v1: Discovery of a Little Red Dot candidate at $z\gtrsim10$ in COSMOS-Web based on MIRI-NIRCam selection
As described in Section IV.3 , we perform image-based morphological fitting across all filters from F150W to F770W where CW-LRD-z10 is detected. In every band and for both the top-5 and the top-75% PSFs, the point source model results in a lower BIC than the Sérsic profiles. This result strongly supports the interpretation that the object is compact and unresolved at JWST resolution. This compactness is further and independently confirmed in the flux-FWHM plane (Appendix C ), where CW-LRD-z10 follows the same sequence as the point source objects. The lower limit on the effective radius in our image-based fitting is ′′ 03 0.\!\!^{\prime\prime}03 , and we use this value as an upper limit for the effective radius. The upper limit corresponds to a projected size of ≲ 120 pc \lesssim 120\,{\rm pc} at z ∼ 10 z\sim 10 , consistent with the size constraints of previous LRDs [ 45 , 2 , 9 , e.g.,] .
Abstract
Little Red Dots (LRDs) are a population of compact, red sources discovered at high redshift with JWST that exhibit distinctive V-shaped spectral energy distributions (SEDs). Existing LRD samples are typically identified using a variety of color-based selection criteria, which can lead to differences in the populations recovered by different studies. We develop a cross-modal machine-learning framework that combines matched NIRCam imaging and NIRSpec/PRISM spectroscopy to transfer spectroscopic information into imaging-based representations, enabling LRD identification from JWST/NIRCam imaging alone. Applied to spectroscopically observed high-redshift galaxies previously classified as non-LRDs, our model identifies 35 new LRD candidates. The majority satisfy at least one independent LRD color selection criterion, and among the 13 candidates with medium- or high-resolution NIRSpec grating spectra, 10 exhibit broad H$α$ emission - a hallmark of LRDs. We further apply the classifier to public NIRCam imaging from the Dawn JWST Archive and two independent JWST surveys, yielding 357 and 23 additional LRD candidates, respectively. The candidates recovered by our method span a broader range of observed SED properties than those in existing samples, suggesting that current color-selected samples may not fully capture the diversity of LRD-like systems present in JWST surveys. Our findings highlight the value of spectroscopy-informed photometric classification as a powerful strategy for systematically mining large-area JWST imaging datasets and provide a practical framework for future studies of this emerging population.
Discussion
Discussion access requires a security token. Register for the weekly digest.