2611.03801v1 · First listed 2026-11-04
Ly$α$ in Compact Broad-Line Emitters, Including Little Red Dots, Is More Closely Linked to the Host Galaxy than to the Broad-Line Nucleus
In 12 z=4.17–5.54 compact broad-line emitters, Lyα is detected in six and is systematically narrower than broad Hα. Host-SED predictions correlate more closely with observed Lyα than nuclear Hα/UV, although excess Lyα permits nuclear emission. [8][5]
Evidence
DIVER JWST/NIRSpec spectroscopy measures Lyα for 12 GOODS-N compact broad-line emitters (CBEs: LRDs, little blue dots, and other broad-line AGN), selected to have secure broad Hα and usable Lyα coverage. Six are detections and six are 2σ upper limits: a 0.50 detection fraction (68% binomial interval 0.36–0.64), with detected rest-EWs of 24–693 Å and limits below 10–127 Å. Detected Lyα has FWHM ≈300–1000 km s⁻¹, versus 1100–3300 km s⁻¹ for broad Hα. The authors therefore argue against directly observed BLR Lyα as the dominant component. [10][2][8]
Earlier work
The sample builds on the CONGRESS/FRESCO and JADES broad-Hα censuses. A CONGRESS analysis found that ≈42% of its broad-Hα emitters fail photometric LRD selection, consistent with this paper treating CBEs as a broader class rather than equating broad-line sources with LRDs. For comparison, non-AGN at matched redshift have a Lyα detection fraction of 0.40 (34/86; 0.34–0.45), statistically overlapping the CBE interval; this is a rate comparison, not evidence that their Lyα production mechanisms are identical. [26][2]
What changes
After subtracting an AGN component, the authors fit dust-attenuated host SEDs without using Lyα spectroscopy or Lyα-containing photometry. Observed Lyα EW and luminosity, including upper limits, follow host-model Lyα more closely than Hα/UV. Yet each detection is 1.5–18 times the host-model Lyα prediction, so the result supports a host-linked observed component while leaving a nuclear contribution. The detected-source median effective Lyα escape fraction is ≈0.09. [8]
Limits and open questions
This is a small, BLR-preselected z<6 sample; it excludes photometric LRD candidates lacking broad-line spectra and narrow-line AGN. Five low-redshift measurements use second-order G140M flux conversions. Although tests give a median converted/first-order flux ratio of 1.01, with 16th–84th percentiles 0.69–1.94, individual relevant fluxes may be uncertain by about a factor of two. The authors report that halving or doubling them does not alter their conclusions. The escape-fraction result applies to detections, not the full sample. [10][9][7]
Evidence includes selected full-text excerpts and figure captions, not the full tables, individual-object measurements, or complete SED-fitting specification. The abstract alone would not support the reported second-order calibration uncertainty; that detail is drawn from the supplied spectroscopy excerpt.
Key figures
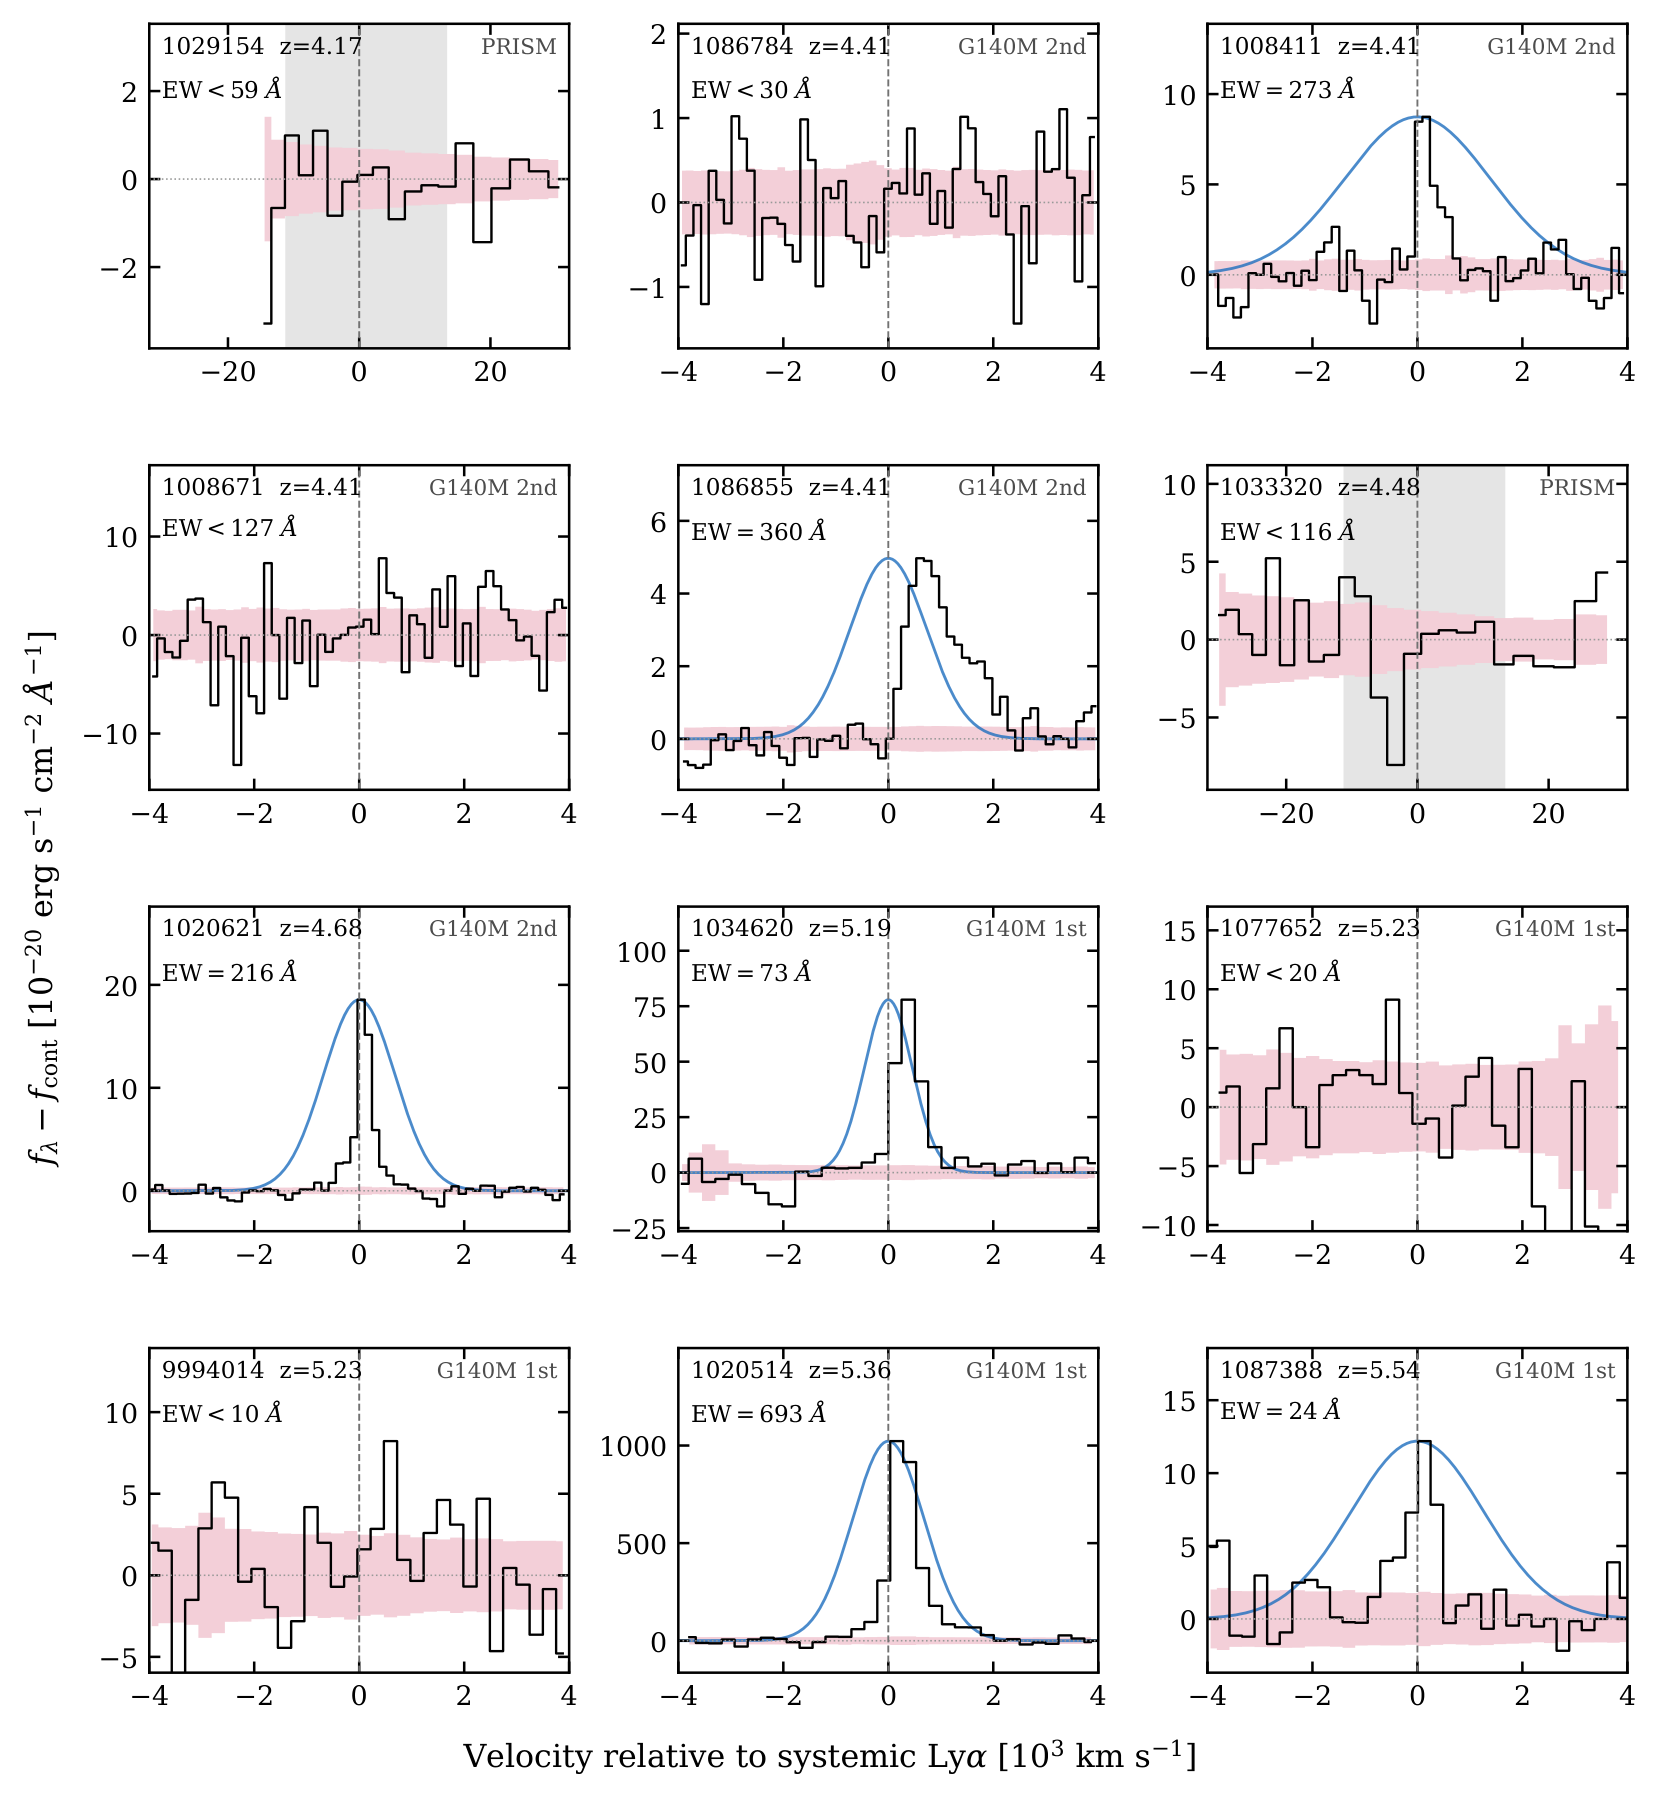
Tests the direct spectral measurement: continuum-subtracted Lyα profiles, rest-EWs, and 2σ nondetection limits for all 12 CBEs, with broad-Hα-width Gaussian comparisons for G140M detections.
Original caption
Figure 1: Ly α \alpha spectra of the 12 CBEs, ordered by redshift, in velocity relative to the systemic (H α \alpha ) redshift. Labels give the adopted spectrum and the rest-frame EW Lyα (2 σ \sigma limits for nondetections). Pink bands show the 1 σ 1\sigma uncertainty, and the local continuum is subtracted. G140M panels span ± 4000 \pm 4000 km s -1 ; second-order panels show the apparent, first-order-calibrated flux density, while the adopted line fluxes include the order-dependent response conversion. For G140M detections, blue curves show a Gaussian with the broad-H α \alpha FWHM at the systemic velocity, scaled to the Ly α \alpha peak. The two PRISM panels span ± 32,000 \pm 32{,}000 km s -1 , and the gray band marks the rest-frame 1170–1270 Å integration window. For 1033320, second-order G140M Ly α \alpha falls in a spectral gap, and we adopt the PRISM constraint.
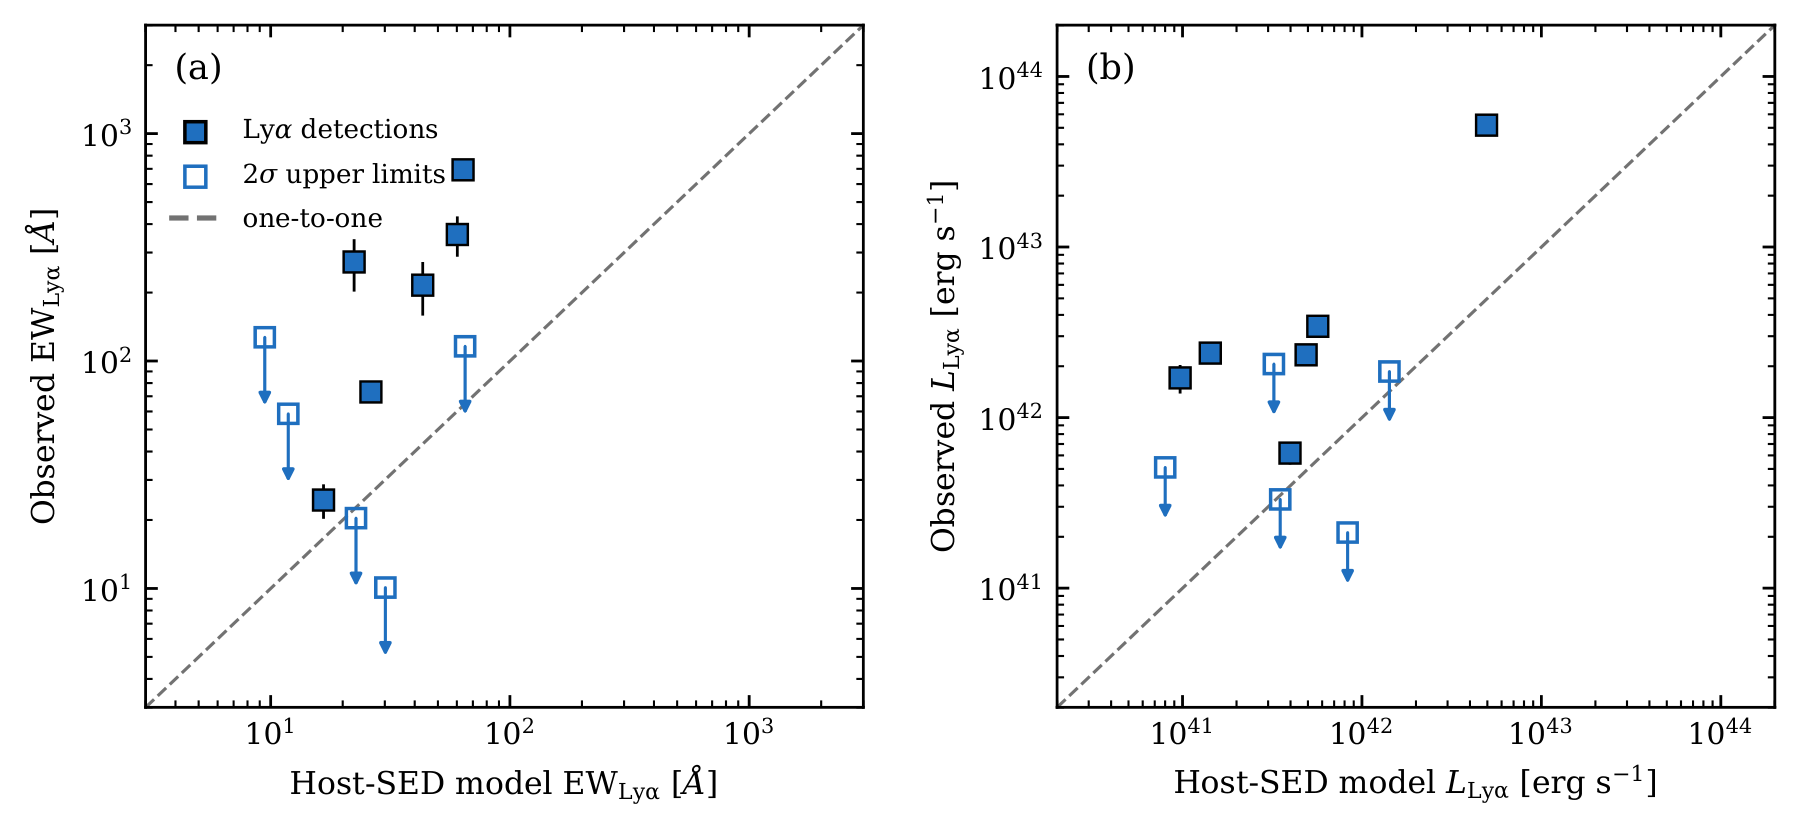
Tests the host-link interpretation by comparing observed Lyα EW and luminosity with predictions of host SED fits that exclude Lyα spectral and photometric constraints; detections and upper limits are shown against equality.
Original caption
Figure 4: Observed Ly α \alpha versus the Ly α \alpha emission in the dust-attenuated best-fit host SED model, in (a) EW and (b) luminosity. The host model uses neither the spectroscopic Ly α \alpha nor photometry containing Ly α \alpha . Filled squares show the six detections with 1 σ \sigma error bars, and open squares with arrows show 2 σ \sigma upper limits. The dashed line marks equality. 1086784 has no coherent host-model Ly α \alpha and is omitted.
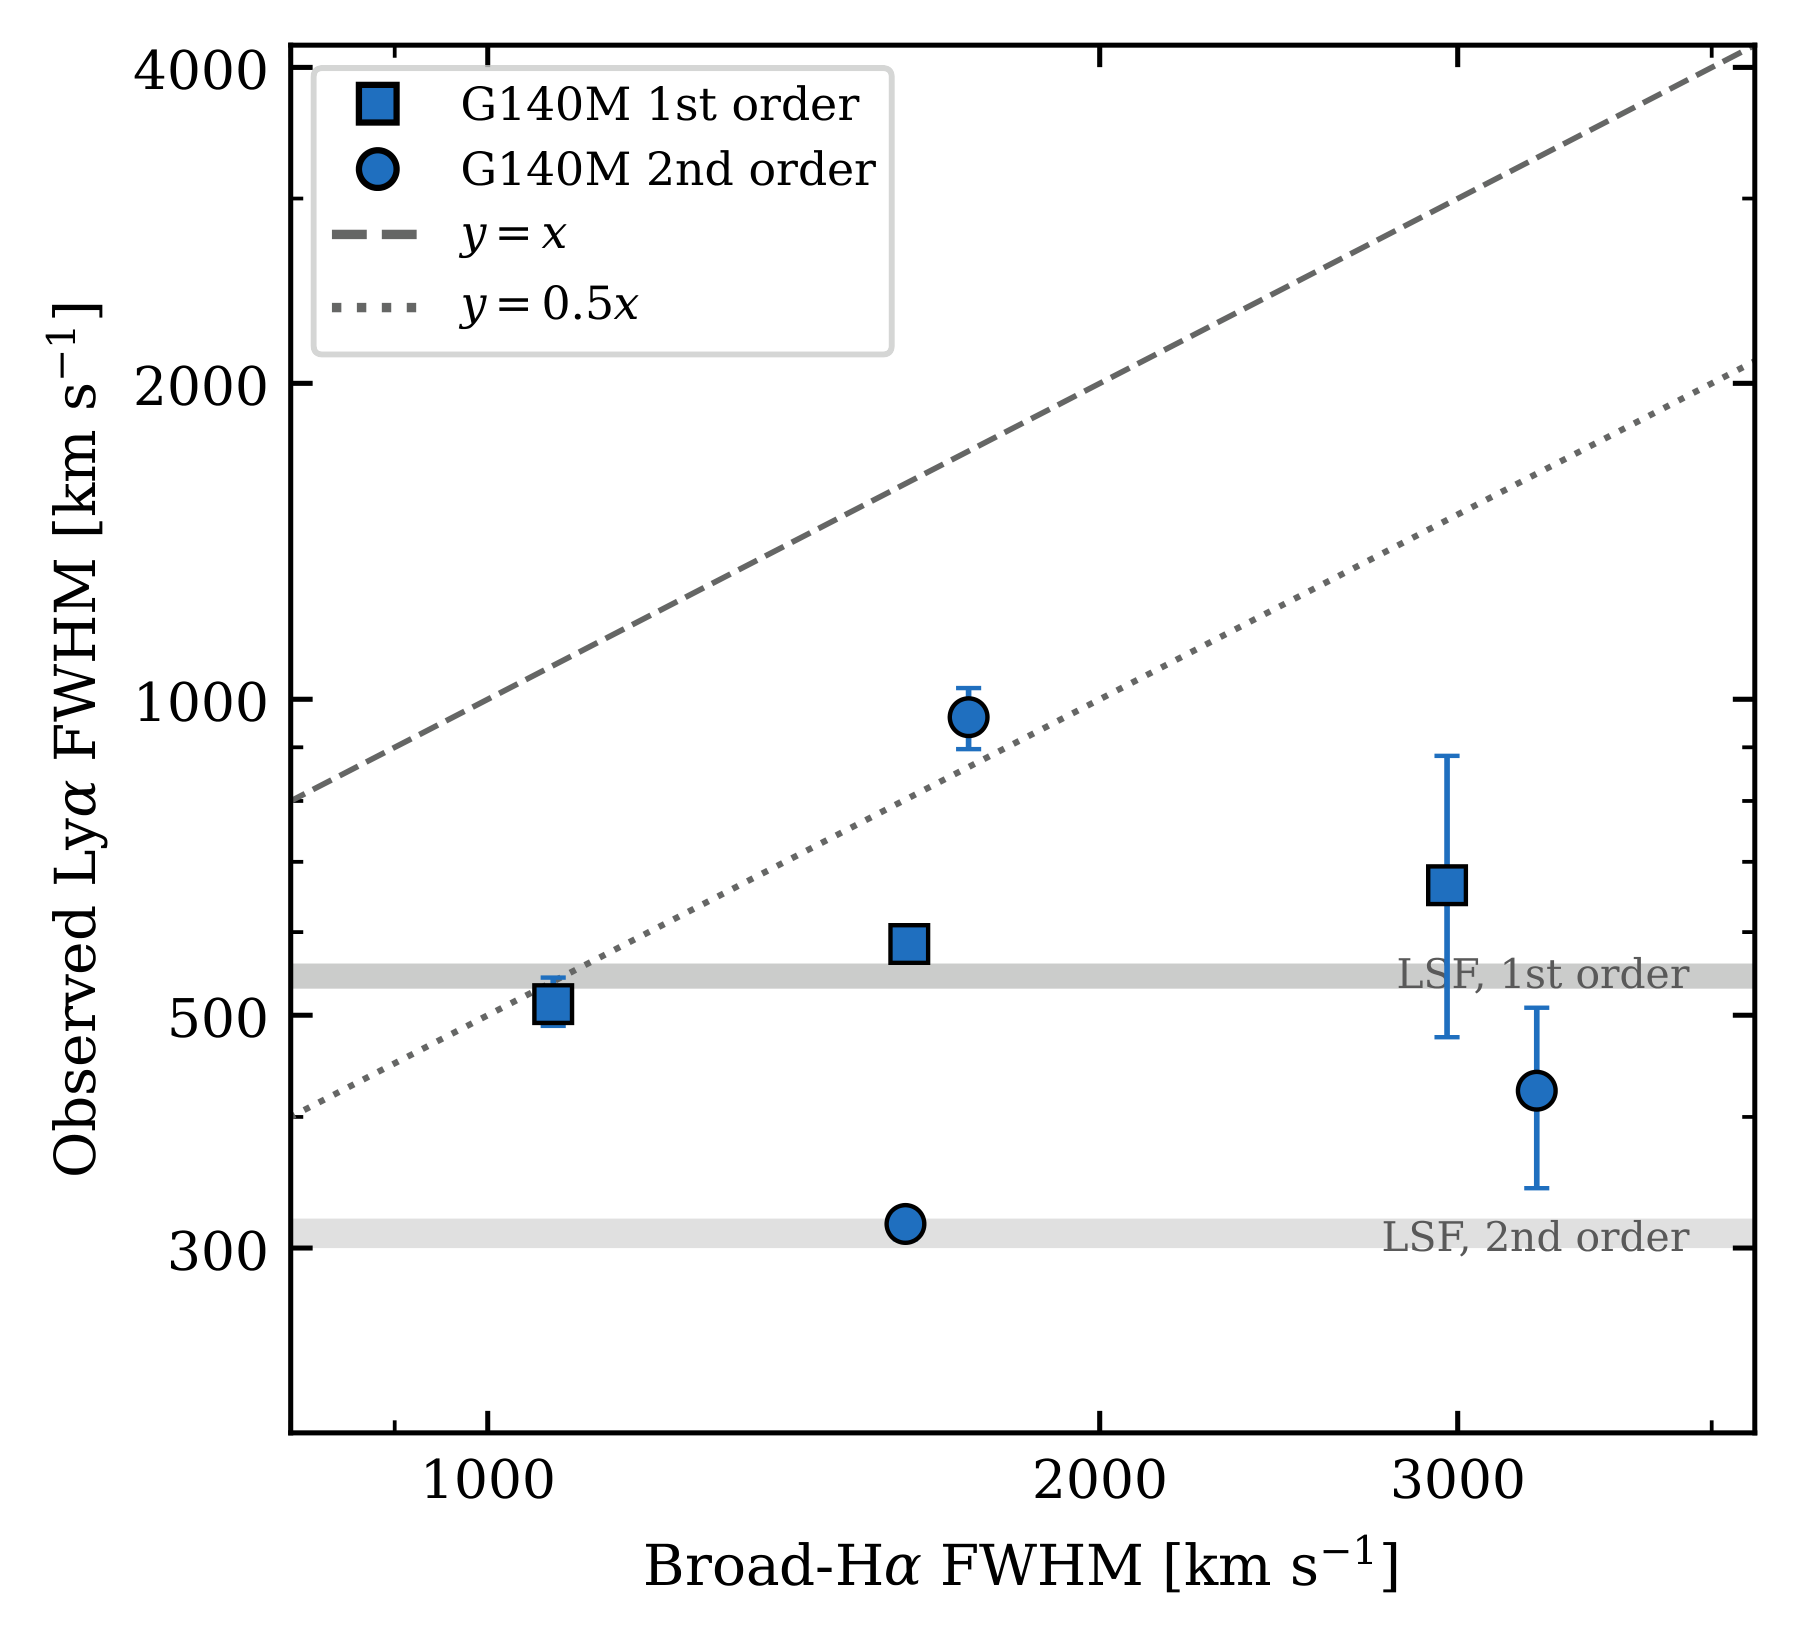
Tests whether observed Lyα is BLR-width: all six detected Lyα lines are compared with broad-Hα FWHM, while instrumental broadening and the apparent half-width expected under blue-side absorption are indicated.
Original caption
Figure 5: Observed Ly α \alpha FWHM versus broad-H α \alpha FWHM for the six detections, from first-order (squares) and second-order (circles) G140M spectra. The Ly α \alpha widths include instrumental broadening; gray bands mark the nominal instrumental FWHM for each order. The dashed line marks equal widths, and the dotted line marks y = 0.5 x y=0.5x , the approximate apparent width of a BLR-width line whose blue half is absorbed.
Related research
Previous digest
Using deep JWST/NIRSpec DIVER spectroscopy, Zhu et al. measure Lyα in 12 compact broad-line emitters at z=4.2–5.5 in GOODS-N, spanning little red dots, little blue dots, and related broad-line AGN. Six sources are detected, but their Lyα lines are narrow (FWHM ≈300–1000 km s⁻¹) relative to broad Hα (1100–3300 km s⁻¹), while the most Hα-strong objects include Lyα weak detections and nondetections. AGN-subtracted host SED fits instead predict the observed Lyα equivalent widths and luminosities more closely than nuclear Hα/UV measures, indicating that the escaping Lyα is primarily linked to the host galaxy rather than the visible broad-line nucleus. Detected sources still exceed the host-model Lyα by factors of 1.5–18, allowing a nuclear component, but their median effective Lyα escape fraction of 0.09 points to typically modest and highly variable ionizing escape from CBEs.
Sources and evidence (26)
- 2611.03801v1: Ly$α$ in Compact Broad-Line Emitters, Including Little Red Dots, Is More Closely Linked to the Host Galaxy than to the Broad-Line Nucleus
JWST has found many faint broad-line AGN at $z>4$, but it is unclear whether the Ly$α$ we see from them comes from the accreting black hole or from its host galaxy. The answer matters for how these sources are interpreted and for how many ionizing photons they release. We use deep JWST/NIRSpec spectroscopy from the DIVER program to measure Ly$α$ in 12 compact broad-line emitters (CBEs) at $z=4.2$--5.5 in GOODS-N. CBEs include little red dots (LRDs), little blue dots, and other broad-line AGN. Six are detected in Ly$α$. Every source shows a broad-line region, yet Ly$α$ does not follow it: the sources with the strongest H$α$ relative to the UV include weak detections and nondetections, and every detected Ly$α$ line (FWHM $\approx300$--1000~km~s$^{-1}$) is narrower than broad H$α$ (1100--3300~km~s$^{-1}$). Instead, Ly$α$ appears to track the host galaxy. We model the AGN-subtracted host with a dust-attenuated SED fit. Including the upper limits, the observed Ly$α$ follows the Ly$α$ production in this host model more closely than it follows H$α$/UV, in both equivalent width and luminosity. Every detection exceeds its host-model value by a factor of 1.5--18, leaving room for a nuclear contribution. The black hole is visible in these sources, but the Ly$α$ we observe is more closely tied to its host. The median effective Ly$α$ escape fraction of the detections is only 0.09, which suggests that ionizing escape from CBEs is typically modest and varies widely.
- 2611.03801v1: Ly$α$ in Compact Broad-Line Emitters, Including Little Red Dots, Is More Closely Linked to the Host Galaxy than to the Broad-Line Nucleus
The 12 sources include six Ly α \alpha detections and six 2 σ \sigma upper limits, a detection fraction of 0.50 (68% binomial confidence interval 0.36–0.64). Non-AGN galaxies at the same redshifts have a similar detection fraction of 0.40 (34 of the 86 with Ly α \alpha measurements at z = 4.17 z=4.17 –5.54; 0.34–0.45). The detections span EW Ly α = 24 {}_{\rm Ly\alpha}=24 –693 Å, and the limits span EW Ly α < 10 {}_{\rm Ly\alpha}<10 to < 127 <127 Å.
- 2611.03801v1: Ly$α$ in Compact Broad-Line Emitters, Including Little Red Dots, Is More Closely Linked to the Host Galaxy than to the Broad-Line Nucleus
We measured Ly α \alpha in 12 CBEs at z = 4.17 z=4.17 –5.54 with DIVER JWST/NIRSpec spectroscopy, finding six detections and six upper limits. We learn three things.
- 2611.03801v1: Ly$α$ in Compact Broad-Line Emitters, Including Little Red Dots, Is More Closely Linked to the Host Galaxy than to the Broad-Line Nucleus
A visible BLR does not make Ly α \alpha bright: the Ly α \alpha strength does not follow H α \alpha or H α \alpha /UV.
- 2611.03801v1: Ly$α$ in Compact Broad-Line Emitters, Including Little Red Dots, Is More Closely Linked to the Host Galaxy than to the Broad-Line Nucleus
The observed Ly α \alpha is unlikely to come directly from the BLR: every detected line is narrower than broad H α \alpha .
- 2611.03801v1: Ly$α$ in Compact Broad-Line Emitters, Including Little Red Dots, Is More Closely Linked to the Host Galaxy than to the Broad-Line Nucleus
Ly α \alpha is more closely tied to the host galaxy than to the nucleus, with room for a nuclear contribution.
- 2611.03801v1: Ly$α$ in Compact Broad-Line Emitters, Including Little Red Dots, Is More Closely Linked to the Host Galaxy than to the Broad-Line Nucleus
The low Ly α \alpha visibility of these sources (median f esc , Ly α eff ≈ 0.09 f_{\rm esc,Ly\alpha}^{\rm eff}\approx 0.09 ) suggests modest ionizing escape, so faint AGN are unlikely to dominate reionization. Deep rest-UV spectroscopy and Ly α \alpha maps of larger samples will show how host and nuclear Ly α \alpha combine.
- 2611.03801v1: Ly$α$ in Compact Broad-Line Emitters, Including Little Red Dots, Is More Closely Linked to the Host Galaxy than to the Broad-Line Nucleus
JWST has found many faint broad-line AGN at z > 4 z>4 , but it is unclear whether the Ly α \alpha we see from them comes from the accreting black hole or from its host galaxy. The answer matters for how these sources are interpreted and for how many ionizing photons they release. We use deep JWST/NIRSpec spectroscopy from the DIVER program to measure Ly α \alpha in 12 compact broad-line emitters (CBEs) at z = 4.2 z=4.2 –5.5 in GOODS-N. CBEs include little red dots (LRDs), little blue dots, and other broad-line AGN. Six are detected in Ly α \alpha . Every source shows a broad-line region, yet Ly α \alpha does not follow it: the sources with the strongest H α \alpha relative to the UV include weak detections and nondetections, and every detected Ly α \alpha line (FWHM ≈ 300 \approx 300 –1000 km s -1 ) is narrower than broad H α \alpha (1100–3300 km s -1 ). Instead, Ly α \alpha appears to track the host galaxy. We model the AGN-subtracted host with a dust-attenuated SED fit. Including the upper limits, the observed Ly α \alpha follows the Ly α \alpha production in this host model more closely than it follows H α \alpha /UV, in both equivalent width and luminosity. Every detection exceeds its host-model value by a factor of 1.5–18, leaving room for a nuclear contribution. The black hole is visible in these sources, but the Ly α \alpha we observe is more closely tied to its host. The median effective Ly α \alpha escape fraction of the detections is only 0.09, which suggests that ionizing escape from CBEs is typically modest and varies widely.
- 2611.03801v1: Ly$α$ in Compact Broad-Line Emitters, Including Little Red Dots, Is More Closely Linked to the Host Galaxy than to the Broad-Line Nucleus
F070LP/G140M covers first-order Ly α \alpha at z ≳ 4.8 z\gtrsim 4.8 . At lower redshift, Ly α \alpha is recorded in second order at an apparent wavelength λ app = 2 × 1215.67 ( 1 + z ) \lambda_{\rm app}=2\times 1215.67\,(1+z) Å. This falls in the extended range, whose calibration assumes first-order light. We convert second-order line fluxes to true fluxes with the ratio of the first- and second-order sensitivity curves of msaexp [ 9 ] and the wavelength Jacobian, d λ app = 2 d λ true d\lambda_{\rm app}=2\,d\lambda_{\rm true} , for apparent wavelengths of 1.30–2.00 μ \mu m. The conversion factors for our five second-order measurements are 3.19–5.05, and a ± 0.002 μ \pm 0.002~\mu m shift in apparent wavelength changes them by ≲ 4 % \lesssim 4\% . We test the conversion with sources at z > 4.8 z>4.8 , whose Ly α \alpha appears in both orders of the same G140M spectrum. For the 13 with second-order S / N ≥ 5 {\rm S/N}\geq 5 , at true wavelengths of 0.75–0.98 μ \mu m, the converted second-order fluxes are a median of 1.01 times the first-order fluxes (16th–84th percentiles 0.69–1.94). Our second-order lines lie at 0.66–0.69 μ \mu m, where the second-order sensitivity rises steeply, so individual fluxes may be uncertain by a factor of ∼ 2 \sim 2 . Halving or doubling them does not change our conclusions (Sections III.2 and IV.2 ). PRISM gives only marginal Ly α \alpha fluxes for 1086855 and 1008411 (S/N of 2.8 and 1.1), 0.5 and 0.2 times the converted values. Near the blue end of PRISM, Ly α \alpha fluxes of other DIVER sources scatter widely and include significantly negative values, so we do not use PRISM to test the conversion.
- 2611.03801v1: Ly$α$ in Compact Broad-Line Emitters, Including Little Red Dots, Is More Closely Linked to the Host Galaxy than to the Broad-Line Nucleus
The sample contains the 12 sources with secure broad H α \alpha in the CONGRESS/FRESCO census of J. Zhang et al. [102] and the JADES census of I. Juodžbalis et al. [52] that have usable DIVER Ly α \alpha coverage (Table 1 ). We restrict the sample to z < 6 z<6 , because IGM attenuation of Ly α \alpha rises steeply at higher redshift [ 50 , 105 , 19 , e.g.,] . Our test requires a directly visible BLR, so the sample excludes photometric LRD candidates without broad-line spectroscopy and narrow-line AGN. J. Zhang et al. [102] identify the LRDs among these broad-H α \alpha emitters with color selections [ 54 , see also] and find that 42%–47% of them are not LRDs. We analyze the CBEs as one population and do not classify individual objects.
- 2608.25021v1: The ionizing properties of JWST's compact broad-line emitters
The resulting escaping ionizing-photon production rate density at z = 5 z=5 is log ( N ˙ ion / s − 1 Mpc − 3 ) = 50.82 − 0.17 + 0.14 \log(\dot{N}_{\rm ion}/\mathrm{s^{-1}\,Mpc^{-3}})=50.82^{+0.14}_{-0.17} , consistent with the ionizing emissivity inferred from the Ly α \alpha forest at these redshifts ( Becker and Bolton, 2013 ) . Uncertainties are the 68 % 68\% confidence intervals from a Monte Carlo propagation of the uncertainties in the adopted f esc f_{\mathrm{esc}} , ξ ion \xi_{\rm ion} , L UV / L H α L_{\rm UV}/L_{\rm H\alpha} conversions, LF normalizations, and the AGN/non-AGN split. Star-forming galaxies supply the bulk of this budget ( ≈ 92.5 − 8 + 4 % \approx 92.5^{+4}_{-8}\% ), while the full broad-line population contributes ≈ 5 % \approx 5\% . Within the latter, the compact blue BLEs dominate ( ≈ 3.9 − 2 + 6 % \approx 3.9^{+6}_{-2}\% of the total), whereas the AGN and the LRDs contribute only ≈ 0.9 − 0.7 + 2 % \approx 0.9^{+2}_{-0.7}\% and ≈ 0.3 − 0.3 + 5 % \approx 0.3^{+5}_{-0.3}\% respectively. As expected by the correlation between Balmer break and f esc f_{\mathrm{esc}} , although the LRDs contribute the most to the broad-H α \alpha LF, they are negligible reionizers. The broad-line contribution to reionization is therefore carried almost entirely by the minority of low-column sources. We consider this the “fiducial” model. Its principal uncertainty is precisely the composition of the broad-line population below our completeness limit, which the luminosity split fixes by construction. Adopting instead an equal split between AGN and non-AGN broad-line emitters, the latter divided between LRDs ( 33.5 % 33.5\% ) and compact blue BLEs ( 16.5 % 16.5\% ), raises the broad-line share of the ionizing budget to 11.8 − 6.2 + 10.8 % 11.8^{+10.8}_{-6.2}\% , with the AGN term alone growing from 0.9 % 0.9\% to ∼ 8 % \sim 8\% . The two scenarios differ by a factor of ∼ 2.5 \sim 2.5 in broad-line emissivity while remaining statistically consistent with one another. Both scenarios fall well short of the ≳ 50 % \gtrsim 50\% required for AGN-dominated reionization ( Madau et al., 2024 ) , but a ∼ 5 % \sim 5\% contribution is non-negligible, particularly tow
- 2608.25021v1: The ionizing properties of JWST's compact broad-line emitters
What fraction of sources exhibit bright, blue UV emission that is predominantly powered by the same region as the broad lines? Starting from a parent sample of 4145 galaxies with simultaneous Ly α \alpha -to-H α \alpha coverage, we identify 99 broad-line emitters, of which only 20 ( ≈ 20 \approx 20 %) satisfy our combined blue-slope and UV/optical compactness criteria (Sect. 3 ). Although the PRISM broad-line selection is incomplete and biased toward luminous, red sources – so this fraction is a lower limit (Sect. 3.1 ) – compact blue BLEs represent a genuine minority of the BLE population, consistent with the geometric expectation from our viewing-angle picture (Sect. 6.1 ). We emphasize, however, that the adopted thresholds ( β UV ≤ − 1.5 \beta_{\rm UV}\leq-1.5 and β opt < 0.5 \beta_{\rm opt}<0.5 ) are somewhat arbitrary: in the viewing-angle framework, the transition from compact blue BLE to LRD spectral types is continuous rather than discrete, with the observed β UV \beta_{\rm UV} and β opt \beta_{\rm opt} varying smoothly as a function of the line-of-sight column density (Sect. 5.2 ).
- 2507.17738v1: Beyond the Dot: an LRD-like nucleus at the Heart of an IR-Bright Galaxy and its implications for high-redshift LRDs
The disappearance of the host of the Saguaro at high redshifts led us to look in more detail for the potential presence of undetected hosts around canonical LRDs. By stacking the images of the full sample of 99 LRDs from P. Rinaldi et al. [112] , we found significant excess emission extending to a radius of 0.2 0.2 ″, or ≈ 2 – 3 \approx 2\text{--}3 kpc in diameter. That is, on average canonical LRDs at high redshift tend to lie within an enveloping galaxy that is not apparent at typical imaging depths due to surface brightness dimming.
- 2507.17738v1: Beyond the Dot: an LRD-like nucleus at the Heart of an IR-Bright Galaxy and its implications for high-redshift LRDs
We present the results of the AGN–host image decomposition using both HST and JWST/NIRCam data in Table 3 . We present the data, model, and residual images in 1.5 ″ × 1.5 ″ 1.5\arcsec\times 1.5\arcsec cutouts in Figure 9 . We report the residuals in the Δ \Delta Flux metric, which quantifies the percentage difference between the model (AGN + host) and the observed flux within the same aperture. This quantity is evaluated across circular apertures with radii ranging from 0.1 ″ 0.1\arcsec to 0.6 ″ 0.6\arcsec . Across all HST and JWST bands, the residual flux after AGN-host decomposition remains modest, with average values around 6–7% and typically below 10% at all apertures, thus leading to a negligible impact on the photometric measurements for both host and AGN.
- 2604.14551v1: Discovery of low-redshift analogues to "Little Red Dots" in DESI: A later evolutionary stage of compact LRDs?
We have conducted a systematic search for low-redshift analogues to the high-redshift LRD population within the DESI DR1 spectroscopic survey. Our search identified five objects at 0.2 < z < 0.4 0.2<z<0.4 that share the defining characteristics of the LRD. Our findings are summarized below.
- 2604.14551v1: Discovery of low-redshift analogues to "Little Red Dots" in DESI: A later evolutionary stage of compact LRDs?
Unlike high-redshift LRDs, our low-redshift analogues are unambiguously classified as AGN by BPT/VO diagnostics. This suggests they reside in more chemically mature, relatively metal-rich host galaxies.
- 2509.03576v1: How similar are narrow-line Seyfert 1 galaxies and high-z type 1 AGN?
Early observations of the host galaxy of nearby NLS1s revealed a very high fraction (up to 100%) of barred spirals ( Krongold et al., 2001 ; Crenshaw et al., 2003 ; Ohta et al., 2007 ) . The Hubble Space Telescope confirmed this result, showing that the vast majority of NLS1s are hosted in spirals with pseudobulges ( Mathur et al., 2012 ) . This supports the hypothesis that the black hole in NLS1s is fed by means of secular evolution, with the bar playing an essential role in transporting the gas from the outer regions of the galaxy to its nucleus ( Orban de Xivry et al., 2011 ) . This result is in agreement with studies on the large-scale environment of NLS1s, which, unlike other AGN, tend to be found either in voids or, more generally, in low-density environments ( Järvelä et al., 2017b ) . Additionally, the host galaxy of NLS1s is characterized by strong circumnuclear star formation, located in the bar or rings. These star-forming regions have been identified using polycyclic aromatic hydrocarbons as tracers ( Sani et al., 2010 ) , by their strong radio emission ( Caccianiga et al., 2015 ) or, more recently, by subtracting the nuclear point-spread function from integral-field observations ( Winkel et al., 2022 ) .
- 2509.03576v1: How similar are narrow-line Seyfert 1 galaxies and high-z type 1 AGN?
could be misclassified as FSRQs or just grouped with the large category of unidentified Fermi objects ( Foschini et al., 2021 ; Foschini et al., 2022 ) . The existence of gamma-ray emitting NLS1s, in conclusion, proves that the blazar sequence is valid only if the sources have comparable black hole mass, but it needs to be updated if different mass ranges are included.
- 2604.19988v1: Pulsational mass loss from supermassive stars creates the compact shells of Little Red Dots
Finally, we translate the episode-integrated results into a small set of observer-facing quantities. Alongside the escape speed, we define two characteristic pulsation speed scales,
- 2604.19988v1: Pulsational mass loss from supermassive stars creates the compact shells of Little Red Dots
The shell quantities strengthen the same conclusion. Across the entire grid, the shell identified in Table A2 remains compact and optically thick, with τ es \tau_{\rm es} between ∼ 7.4 × 10 2 \sim 7.4\times 10^{2} and 1.3 × 10 4 1.3\times 10^{4} . Thus, the production of a dense inner shell is not restricted to one metallicity. What changes with Z Z is the balance between total ejecta mass, shell compactness, and terminal stellar state. In this sense, the Z = 10 − 2 Z ⊙ Z=10^{-2}\,Z_{\odot} model is not special because it maximizes the ejected mass. It is special because it provides the clearest LRD analogue, combining the coolest enriched terminal state with a compact optically thick shell.
- 2602.22305v1: You can't see me: super-Eddington growth hindering X-ray detection in high-z broad-line AGNs
Figure 9 : Cumulative black hole spin distribution predicted by the combined MCMC analysis based on X-ray and broad-line emission. Red and blue curves show the results for the high-mass and low-mass solutions, respectively. Assuming the high BH mass solution, the analysed population would systematically require low spin values, with a < 0.2 a<0.2 for ≈ 50 % \approx 50\% of sources, in order to remain consistent with the X-ray non-detections.
- 2602.22305v1: You can't see me: super-Eddington growth hindering X-ray detection in high-z broad-line AGNs
In addition, it is important to stress that LRDs represent only ∼ 10 − 30 % \sim 10-30\% of the broad-line AGN population detected at high redshift. Consequently, the vast majority of sources still exhibit a complete lack of X-ray detection, without clear indications of dense gas along the line of sight. If, as recently suggested by Brazzini et al. (2026) , LRDs and the broader population of Little Blue Dots are powered by the same central engines and differ primarily in geometry and/or in the evolutionary stage of their surrounding environments, this would imply that both populations are intrinsically X-ray weak. In this framework, the presence of dense gas in the minority of sources displaying a steep red optical continuum would further enhance their apparent X-ray weakness.
- 2603.10162v1: The X-ray weakness of Little Red Dots and JWST-selected AGN: comparison with local AGN in different accretion regimes
Table 1 : Summary of the AGN subsamples used in this work, including selection criteria, sample size, and the method adopted to derive key physical parameters. 2 2 2 References. (1) Mejía-Restrepo et al. (2022) ;(2) Ricci et al. (2017) ; (3) Gupta et al. (2024) ; (4) Wu and Shen (2022) ; (5) Webb et al. (2020) ; (6) Jin et al. (2012b) ; (7) Du et al. (2014) ; (8) Du et al. (2015) ; (9) Castelló-Mor et al. (2016) ; (10) Tortosa et al. (2023) ; (11) Yue et al. (2024) ; (12) Maiolino et al. (2025) ; (13) Lin et al. (2026) .
- 2603.10162v1: The X-ray weakness of Little Red Dots and JWST-selected AGN: comparison with local AGN in different accretion regimes
We note that in low-redshift comparison samples (BASS, SDSS–4XMM, NLS1s, and SEAMBHs), all sources have both broad H α \alpha and X-ray measurements as a natural consequence of the sample construction and survey depths, rather than as a result of additional selection cuts applied in this work. In particular, the SDSS–4XMM sources are optically classified as type I AGN based on the presence of a broad H α \alpha line component in their SDSS spectra, with no similarly broad [OIII] counterpart, while their X-ray detections arise from archival XMM- Newton observations of sufficient depth at low z z . Similarly, BASS AGN are bright, nearby systems with well-characterized optical broad-line emission and X-ray detections. In contrast, the LRDs and JWST-selected AGN are primarily selected via rest-frame UV and optical spectroscopy, and their X-ray measurements are almost exclusively limited to upper limits due to their observed X-ray weakness and current sensitivity constraints. Indeed, if their spectra are intrinsically steep (i.e., very soft), then at high z z much of the emission is redshifted out of the observed band, leading to a substantial loss of detected photons with current X-ray instruments. This difference reflects observational limitations rather than intrinsic selection biases and should be borne in mind when comparing the distributions.
- 2505.02895v1: Abundant Population of Broad H$α$ Emitters in the GOODS-N Field Revealed by CONGRESS, FRESCO, and JADES
Examples of galaxy SED-fitting results are presented in Figure 6 . Due to the limited wavelength coverage, we have only seen AGN evidence from SED analysis in 10 out of 19 galaxies despite the existence of a broad H α \alpha emission line. Therefore, follow-up MIRI observations to obtain mid-infrared data for these broad H α \alpha emitters would be valuable for better constraining their physical properties. Table 3 lists the best-fit values of M ∗ M_{*} for all broad H α \alpha emitters. The typical statistical uncertainty in M ∗ M_{*} estimates derived using Prospector is less than 0.1–0.15 dex, which is smaller than the systematic uncertainties introduced by variations (e.g., 0.2–0.3 dex) in SED model choices, such as the star formation history. Therefore, we adopt a conservative uncertainty of 0.3 dex for our M ∗ M_{*} measurements. Table 3 also summarizes the key physical properties of the 19 broad H α \alpha emitters.
- 2505.02895v1: Abundant Population of Broad H$α$ Emitters in the GOODS-N Field Revealed by CONGRESS, FRESCO, and JADES
The left panel of Figure 8 shows the positions of the broad H α \alpha emitters on the color-color plot. We find that a significant fraction of our sample ( ∼ \sim 42%) cannot be photometrically selected as LRDs, with the majority (7 out of 8) failing to meet the red slope criterion. This result is consistent with Hainline et al. [19] , who applied a stricter red slope threshold and found that only 30% of spectroscopically identified BLAGN with JWST meet the LRD selection criteria. These findings suggest that not all broad-line emitters with a compact, red appearance exhibit the characteristic “V-shaped” SED of LRDs, and that many lack a steep red slope.
Abstract
JWST has found many faint broad-line AGN at $z>4$, but it is unclear whether the Ly$α$ we see from them comes from the accreting black hole or from its host galaxy. The answer matters for how these sources are interpreted and for how many ionizing photons they release. We use deep JWST/NIRSpec spectroscopy from the DIVER program to measure Ly$α$ in 12 compact broad-line emitters (CBEs) at $z=4.2$--5.5 in GOODS-N. CBEs include little red dots (LRDs), little blue dots, and other broad-line AGN. Six are detected in Ly$α$. Every source shows a broad-line region, yet Ly$α$ does not follow it: the sources with the strongest H$α$ relative to the UV include weak detections and nondetections, and every detected Ly$α$ line (FWHM $\approx300$--1000~km~s$^{-1}$) is narrower than broad H$α$ (1100--3300~km~s$^{-1}$). Instead, Ly$α$ appears to track the host galaxy. We model the AGN-subtracted host with a dust-attenuated SED fit. Including the upper limits, the observed Ly$α$ follows the Ly$α$ production in this host model more closely than it follows H$α$/UV, in both equivalent width and luminosity. Every detection exceeds its host-model value by a factor of 1.5--18, leaving room for a nuclear contribution. The black hole is visible in these sources, but the Ly$α$ we observe is more closely tied to its host. The median effective Ly$α$ escape fraction of the detections is only 0.09, which suggests that ionizing escape from CBEs is typically modest and varies widely.
Discussion
Discussion access requires a security token. Register for the weekly digest.