Weekly issue · Sep 28 – Oct 4, 2026

Week 40, 2026

8 curated papers

Enhanced density fluctuations: consequences for stellar dynamics and dark matter substructure

Wenzer Qin, David E. Kaplan, Neal Weiner

Toy primordial-power enhancements that can accommodate little-red-dot abundances may also yield unusually early, dense halos: depending strongly on enhancement shape, the authors predict low-mass stellar clusters and up to a 6.5-fold excess of massive dark subhalos over ΛCDM.

What changes The new contribution is a unified phenomenological mapping from small-scale initial overdensity and wavenumber to stellar-system outcome, coupled to subhalo predictions. For amplitudes δc,0 ≳4×10^-3 at k~200 Mpc^-1, the authors estimate ~5,000 M⊙ stellar clusters under f*=0.04, at the low-mass end of observed globular clusters; lower-k or larger perturbations can make larger systems. They further argue that earlier-forming enhanced-spectrum subhalos are more compact, potentially improving stellar-stream sensitivity.
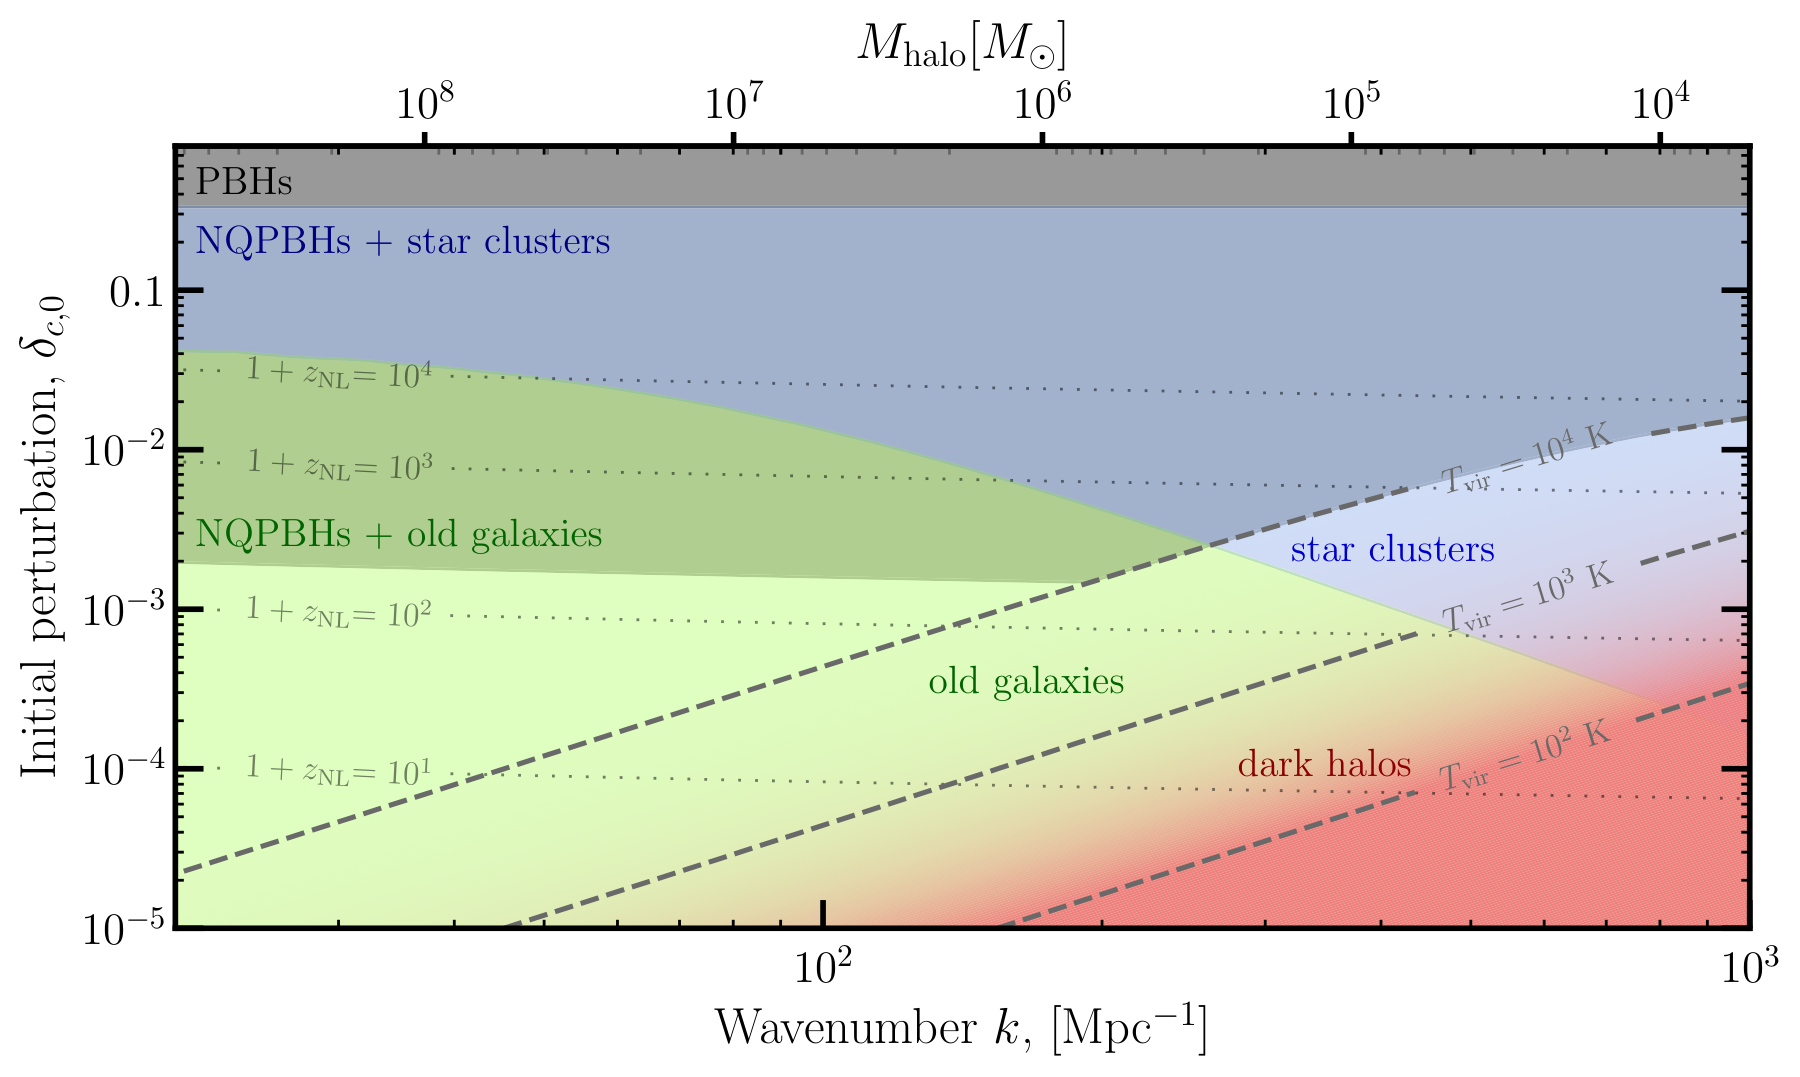
Figure 2 from Enhanced density fluctuations: consequences for stellar dynamics and dark matter substructureFigure 2 · Open paper
Figure notes (3)
  • Figure 2. Tests the analytic regime classification in perturbation amplitude–wavenumber (or halo-mass) space: starless/disrupted halos versus bound old galaxies versus systems where dynamical friction forms star clusters. The fuzzy boundary visualizes supernova-feedback uncertainty.
  • Figure 5. Tests how the assumed initial spectrum propagates into present-day substructure of a 10^12 M⊙ halo in Galacticus. It compares narrow-peak and step enhancements with ΛCDM; plotted error bars are 1σ Poisson uncertainties, and the narrow peak suppresses subhalos below ~10^7 M⊙ while enhancing higher masses.
  • Figure 7. Tests the structural consequence behind the proposed observational handle by comparing maximum-circular-velocity radius with subhalo mass. Earlier formation in enhanced-power cases is interpreted as producing more compact subhalos, relevant to stellar-stream searches.
Connecting the Dots: Prospects for Detecting Multi-Source Inflation through Scale-Dependent and Stochastic Bias of Little Red Dots

Peter L. Taylor, Xinyi Chen, Christopher M. Hirata et al.

This paper forecasts whether a purpose-built, wide space survey of LRD clustering at z=4–9 could jointly constrain local fNL and τNL and test the multi-source Suyama–Yamaguchi inequality; its conclusions remain conditional on idealised survey and covariance assumptions.

What changes The distinctive forecast target is multi-source inflation, operationalised through a strict departure from the Suyama–Yamaguchi single-source lower bound. Rather than forecasting fNL alone, the analysis uses the LRD power-spectrum response to both scale-dependent bias and stochasticity and evaluates detection significance over the fNL–τNL plane. It also connects the statistical forecast to a notional infrared survey architecture, including long-wavelength imaging and spectroscopy over a DESI-like footprint. This is a proposal-level assessment, not a concrete mission design.

Figure 1 from Connecting the Dots: Prospects for Detecting Multi-Source Inflation through Scale-Dependent and Stochastic Bias of Little Red DotsFigure 1 · Open paper
Figure notes (2)
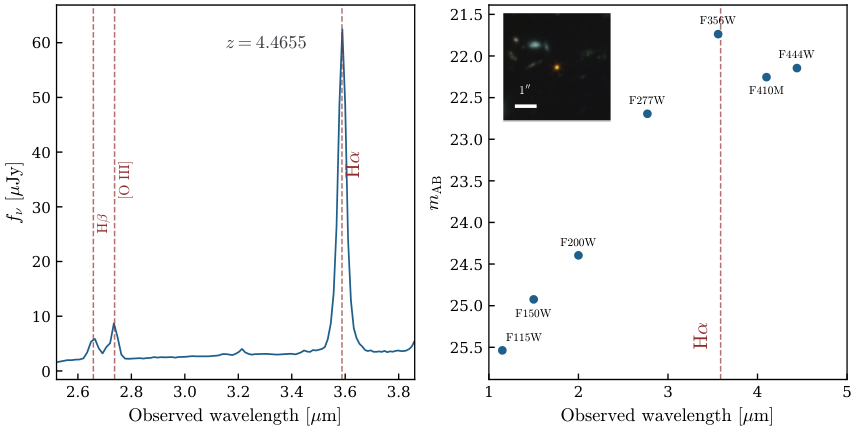
  • Figure 1. Shows the observational motivation for the proposed tracer: a luminous LRD with broad Hα, a rising red continuum, photometry, and imaging. It tests whether the advertised morphology and spectral signatures can identify LRD candidates, not inflationary parameters.
  • Figure 2. Maps Fisher detection significance for multi-source inflation under the Suyama–Yamaguchi relation, comparing a fiducial four-bin LRD analysis with a three-bin case. Its caption flags possible overestimation near the physical boundary because no prior is imposed.

Exploring the observed properties of JWST Little Red Dots with cosmological simulations and dust radiative transfer

Saksham Chandna, Fabio Di Mascia, Simona Gallerani et al.

Forward-modelled z=6–9 zoom simulations find that an obscured accreting black hole plus stellar UV emission and dust geometry can produce selected LRD-like colours and compactness, but reproduce only the moderate-Balmer-break subset of observed LRDs.

What changes The distinctive contribution is an observation-level comparison of otherwise paired AGN and no-BH simulations: dust radiative transfer is propagated through mock imaging, aperture photometry and LRD selection rather than compared only through intrinsic galaxy properties. The authors further interpret LRDs and Little Blue Dots as a continuous distribution: their simulated objects follow a continuous L5100–βopt relation, with relative AGN contribution and line-of-sight attenuation determining placement. This supports, but does not prove, that LRDs need not be an intrinsically separate class.

Figure notes (3)
  • Figure 2. Tests how aperture-extracted synthetic SEDs differ between SFonly and AGNfid suites, across emergent UV luminosity and alternative dust extinction prescriptions; it establishes the forward-modelled spectral input to selection.
  • Figure 4. Tests viewing-angle sensitivity for one z=6.4 simulated object: two sightlines are compared in NIRCam photometry, fitted UV/optical slopes and F444W compactness, showing that selection can change with line of sight.
  • Figure 14. Tests simulated AGNfid SEDs against supplied 5σ far-IR/submillimetre non-detection limits, highlighting selected sightlines that remain compatible with those constraints and relating viability to simulated dust mass.

A tidal disruption event in a quasar at redshift 7.19

S. Fujimoto, Q. Fei, G. B. Brammer et al.

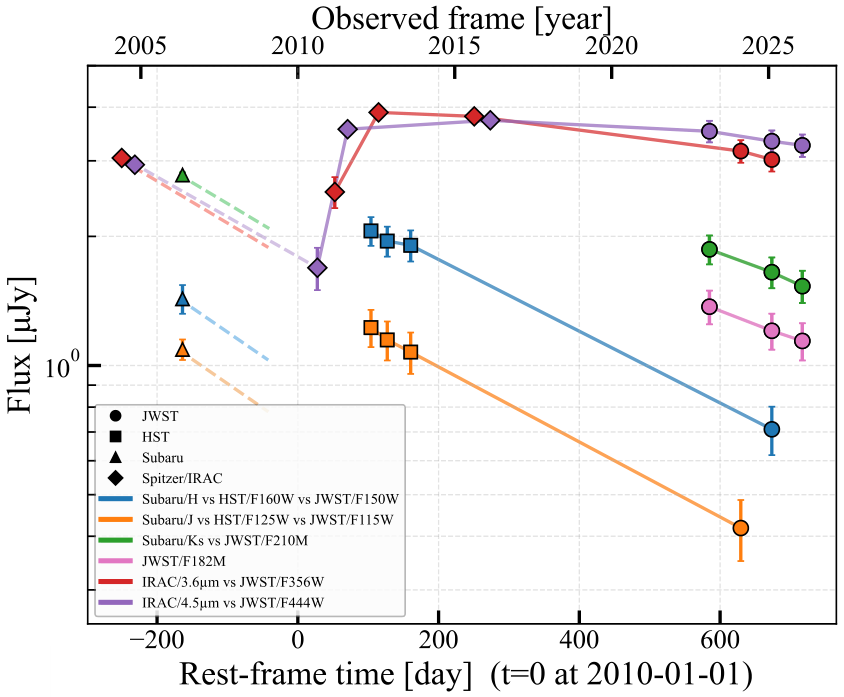
Multi-epoch HST, Spitzer, and JWST observations identify an unusually luminous, chromatically fading nuclear transient in the z=7.19 quasar GNz7q. Its light-curve, spectroscopic, and infrared-echo properties support—rather than uniquely prove—a tidal-disruption interpretation.

What changes The paper combines a long rest-frame light curve, broad-line decomposition, and mid-IR monitoring for a nuclear transient in an already active z>7 quasar. Rather than relying only on photometric amplitude, it tests a panchromatic transient model, comparison-source stability, a superluminous-supernova template, and DRW-like AGN simulations. The reported DRW experiment uses MacLeod-based log-normal priors and finds an extremely low probability for a GNz7q-like smooth multiband event; the SLSN comparison fails in duration and has order-of-magnitude tension with typical SLSN luminosity and energy.

Figure 2 from A tidal disruption event in a quasar at redshift 7.19Figure 2 · Open paper
Figure notes (3)
  • Figure 2. Tests whether the event is a large, coherent chromatic excursion rather than ordinary quasar scatter: the matched-filter photometry gives ~1.1 mag rest-UV fading, and the comparison places GNz7q beyond the SDSS variability tail.
  • Figure 5. Tests spectroscopic support for an unusual transient broad-line component by decomposing two NIRSpec epochs. The redshifted component has FWHM≈11,900 km s^−1 and Δv≈+2,500 km s^−1, with no significant epoch-to-epoch change.
  • Figure 6. Tests whether delayed MIRI emission can be described as thermal reprocessing of the UV–optical flare. Its three-band spectral shape constrains dust temperature near 1500 K, but radius remains partly degenerate with geometry and efficiency.

Cosmic Collisions I: Optical Morphologies for MIRI-selected galaxies from the PRIMER survey

Gregory Troiani, Allison Kirkpatrick, Leyna Bajaj et al.

JWST/MIRI F770W selection and volunteer classifications of 14,657 PRIMER galaxies at 1<z<3 reveal morphology trends unlike optical/near-IR samples, while wavelength-dependent structure and unresolved mid-IR cores complicate physical interpretation.

What changes This work supplies weighted and unweighted morphology, interaction, and surface-feature classifications for a large MIRI-selected cosmic-noon sample, rather than treating rest-optical appearance alone as the selection basis. Its principal empirical contribution is selection-dependent morphology evolution: locally/lower-redshift MIRI detections are more disk-like, whereas distant detections are more compact. The authors suggest dust selection and possible AGN over-representation, respectively, but these are interpretations rather than demonstrated mechanisms.

Figure notes (3)
  • Figure 2. Tests wavelength-dependent appearance on an object-by-object basis by juxtaposing a NIRCam rest-optical composite, the closest rest-frame g-band image, and F770W. It illustrates why mid-IR morphology may not trace the same structure as rest-optical light.
  • Figure 10. Tests redshift dependence of main-morphology and interaction fractions in Clean and Superclean subsets. Equal-population redshift bins are plotted at median redshift; vertical bars are Poisson count errors and horizontal bars span bin quartiles.
  • Figure 11. Tests whether the Figure 10 trends depend on stellar mass by dividing objects into mass terciles above 10^8 solar masses. The caption reports that the interaction-rate peak grows with mass while broad morphology trends change little.

Chandra X-ray Spectral Evidence of the Dual AGN Nature of the Gravitational lens MG B2016+112 at z=3.273 with 175 pc separation

Daniel A. Schwartz, Julia M. Sisk-Reynes, Anna Barnacka

Separate Chandra spectra of the two lensed X-ray emitters in MG B2016+112 support the authors’ dual-AGN interpretation: the inner-caustic component is intrinsically absorbed, disfavoring its alternative identification as a highly magnified jet feature.

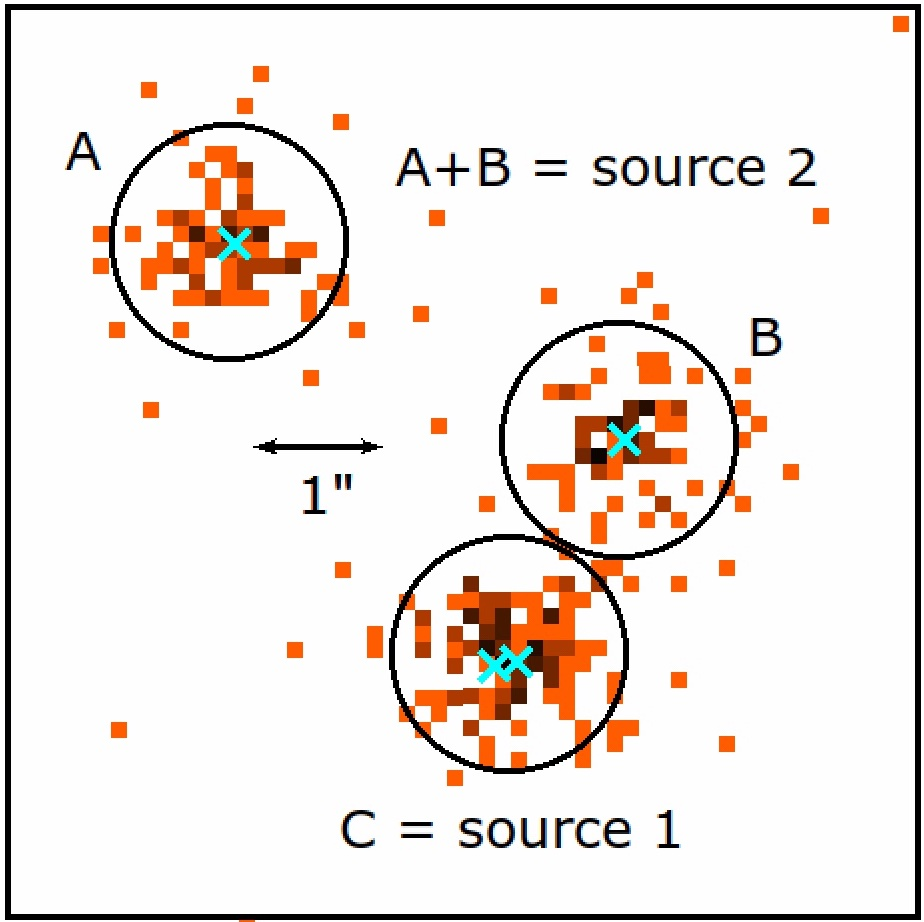
What changes The key discriminant is that absorption local to source 1 cannot, under the authors’ geometry, be reprocessing by source 2’s torus 175 pc away in projection; they therefore infer two separate AGN. This conclusion exploits lensing both for flux amplification and effective source-plane spatial resolution. Figure 1 tests whether the X-ray centroids and extraction regions distinguish the lensed components. Figure 3 tests the absorbed-power-law description after folding it through the Chandra response. Figure 4 tests the absorption result against the Γ–N_H degeneracy by showing marginalized 1–3σ contours.

Figure 1 from Chandra X-ray Spectral Evidence of the Dual AGN Nature of the Gravitational lens MG B2016+112 at z=3.273 with 175 pc separationFigure 1 · Open paper
Figure notes (3)
  • Figure 1. Tests source separation in the Chandra image: 0.90-arcsec apertures, the simulated 80%-encircled-count radius, are placed on the lensed images and compared with VLBI-component positions.
  • Figure 3. Tests the spectral model by comparing response-folded, intrinsically absorbed power laws with each source spectrum; it reports Γ=2.54±0.21 for source 1 and Γ=1.46±0.18 for source 2.
  • Figure 4. Tests whether absorption remains favored when correlated with photon index, through marginalized 1σ, 2σ, and 3σ Γ–N_H contours for each source.

Caught in the act: diffuse stellar and Ly$α$ emission around a halo-less quasar in the assembling cluster CARLA J0800+4029 at z=2

Sofia G. Gallego, Simona Mei, Emanuele Daddi et al.

KCWI and HST reveal that CARLA J0800+4029’s dominant Lyα reservoir is tidal and offset from its radio-loud quasar, while a matched-area quasar-halo limit is 3.4 times lower, consistent with spatially redistributed baryons during cluster assembly.

What changes The central observational result is the joint spatial association of offset Lyα, tidal stellar light, and IHL in a protocluster core, alongside a coherent absorption-like Lyα decrement near +1000 km s^-1. The authors interpret the alignment as evidence that gas and stars have been redistributed together, while treating ionization, depletion, or suppression near the AGN as possible—not uniquely established—explanations for the central Lyα deficit.

Figure 2 from Caught in the act: diffuse stellar and Ly$α$ emission around a halo-less quasar in the assembling cluster CARLA J0800+4029 at z=2Figure 2 · Open paper
Figure notes (3)
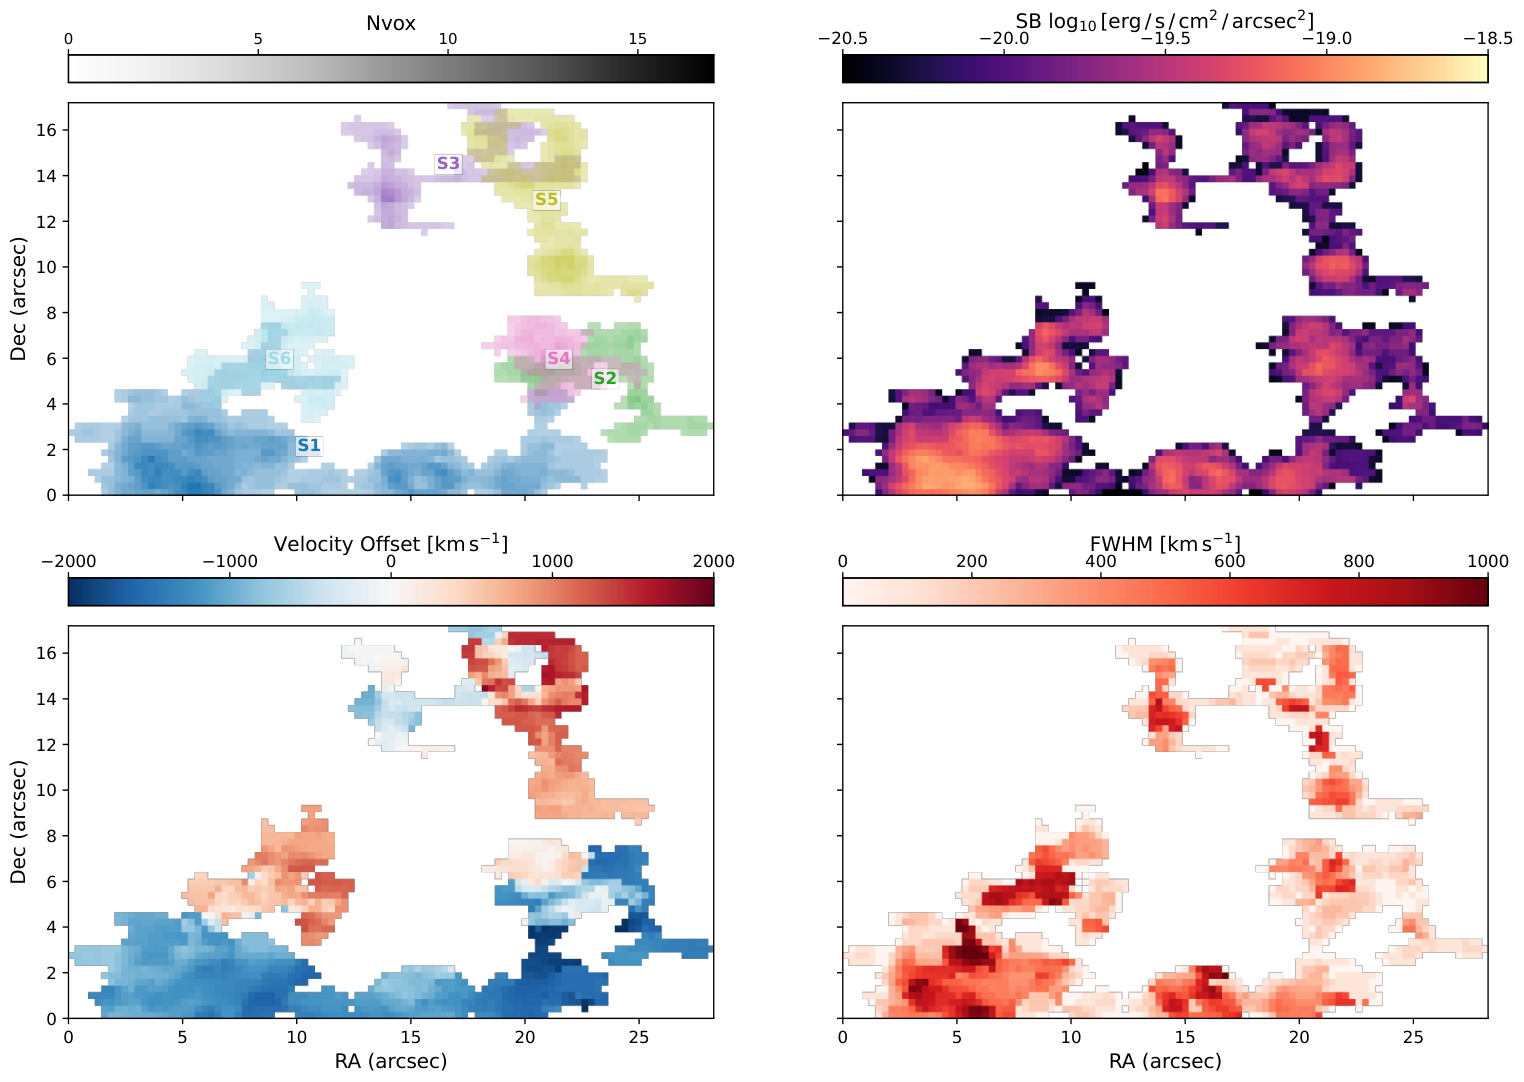
  • Figure 2. Tests the morphology and segmentation of the Lyα field: six connected 3D AKS components are labeled, allowing the dominant extended component to be distinguished from subsidiary structures.
  • Figure 4. Tests whether the stellar counterpart is genuinely diffuse: galaxies are segmentation-masked, then the F140W image is background-subtracted and smoothed before defining IHL regions and measuring their fractions.
  • Figure 8. Tests the quasar-centered non-detection in context by plotting the offset/tidal halo and a matched-area, matched-width 3σ upper limit at the quasar against literature quasar, LAE, group, and cluster halo samples.

SN Helios: A Multiply Imaged Type II Supernova Opening Time-Delay Cosmography beyond redshift of 3

Seiji Fujimoto, Conor Larison, Justin D. R. Pierel et al.

SN Helios is a spectroscopically confirmed, strongly lensed Type II supernova at z=3.34. Its predicted 2–6 yr reappearance could enable time-delay cosmography, but current lens-model spread and the absence of a measured delay preclude an H0 result.

What changes Authors present Helios as a multiply imaged, spectroscopically confirmed Type II SN at z=3.34 and propose it as a future z>3 time-delay-cosmography anchor. They also find no host in rest-UV/optical imaging, emission lines, or ALMA 2 mm continuum, deriving a de-lensed limit MUV≳−13. Separately, galaxy-only fits to its demagnified discovery SED favor a false z≈16 solution, illustrating transient contamination of high-z dropout selections.

Figure 1 from SN Helios: A Multiply Imaged Type II Supernova Opening Time-Delay Cosmography beyond redshift of 3Figure 1 · Open paper
Figure notes (3)
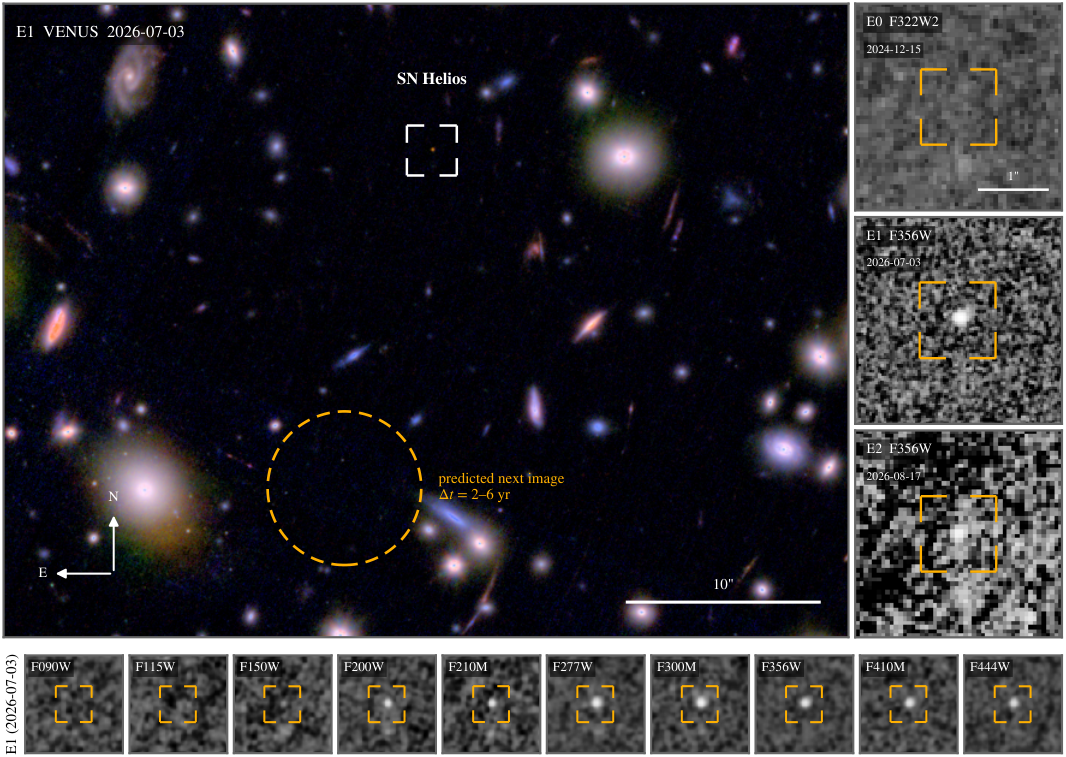
  • Figure 1. Tests transient reality and lensing forecasts: pre-explosion non-detection, discovery, and six-week fading support a transient; the dashed region and five model delays test the predicted location and timing of the next image.
  • Figure 2. Tests the Type II classification by comparing the prism spectrum with forward-modelled templates and resolving the broad hydrogen P-Cygni features that hydrogen-poor templates fail to reproduce.
  • Figure 6. Tests dropout contamination: after demagnification, galaxy-only photometric fitting produces a single high-redshift peak near z≈16 despite the spectroscopic z=3.34 SN interpretation.