2609.30440v1 · First listed 2026-09-28
SN Helios: A Multiply Imaged Type II Supernova Opening Time-Delay Cosmography beyond redshift of 3
SN Helios is a spectroscopically confirmed, strongly lensed Type II supernova at z=3.34. Its predicted 2–6 yr reappearance could enable time-delay cosmography, but current lens-model spread and the absence of a measured delay preclude an H0 result. [1][3]
Evidence
VENUS NIRCam imaging found a red F150W dropout (F277W=26.1 mag) absent in 2024 imaging; second-epoch NIRCam plus a 13.1 ks NIRSpec/prism observation followed. The prism spectrum resolves broad Hα (intrinsic FWHM ≈7900 km s−1) and detects Hα P-Cygni absorption at 8800±500 km s−1 (5.5σ), with Hβ and He I λ10830 counterparts. These features establish a hydrogen-rich expanding photosphere; forward-modelled template fits favor Type II over stripped-envelope or thermonuclear alternatives. Broad-line redshift fitting gives z=3.34 with estimated systematic Δz≈0.01. Local-SN light-curve comparisons yield a rest-frame phase of 27.5±2.8 d after B maximum. Five cluster models predict magnification of roughly 10–20 and a future image after about 2–6 yr, making the time delay a forecast rather than a measurement. [1][7][8][3]
Earlier work
The paper compares Helios with local Type II templates. Its F356W/F444W evolution is reported to resemble the fast-declining SN 2013ej more closely than SN 1999em or SN 2005cs; nevertheless, the latter fits give phases of 30.3±5.2 and 26.4±4.6 d and remain consistent with the SN 2013ej-based result within 1σ. For an observational high-redshift context, AT 2023adya at z=5.274 had only two-epoch, single-band photometric variability and could not be securely typed, unlike the spectroscopically classified Helios. [5][15]
What changes
Authors present Helios as a multiply imaged, spectroscopically confirmed Type II SN at z=3.34 and propose it as a future z>3 time-delay-cosmography anchor. They also find no host in rest-UV/optical imaging, emission lines, or ALMA 2 mm continuum, deriving a de-lensed limit MUV≳−13. Separately, galaxy-only fits to its demagnified discovery SED favor a false z≈16 solution, illustrating transient contamination of high-z dropout selections. [1][3]
Limits and open questions
The delay, reappearance, and cosmological constraint have not yet been observed. Forecast delays vary substantially among lens models; the Figure 1 caption attributes this mainly to limited spectroscopic redshifts for lensing constraints. Phase inference is based on sparse two-epoch photometry and spectral analog matching: Hα comparisons cluster near 20–30 d but have broad scatter. The host result is an upper limit, not a host detection, and the proposed elevated core-collapse rate in ultra-faint galaxies is interpretive rather than directly measured here. [2][9][1]
Evidence includes the abstract, selected full-text passages, and nine supplied captions, but not the numerical lens-model table or full photometric-fitting methodology; model-by-model magnifications and fit assumptions therefore cannot be assessed beyond the extracted statements.
Key figures
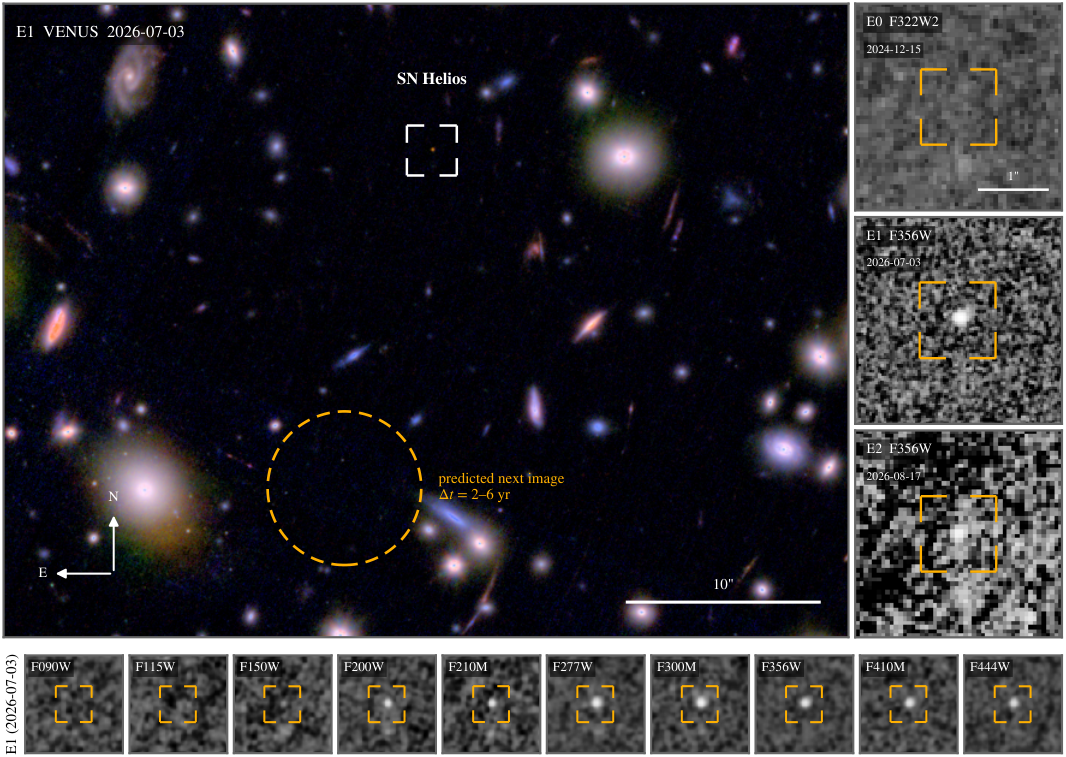
Tests transient reality and lensing forecasts: pre-explosion non-detection, discovery, and six-week fading support a transient; the dashed region and five model delays test the predicted location and timing of the next image.
Original caption
Figure 1: Discovery of SN Helios behind RXC J0018.5+1626. Top: VENUS NIRCam color image of the cluster core at the discovery epoch (2026 July 3; R = = F356W + + F444W, G = = F200W + + F277W, B = = F115W + + F150W, 44 \arcsec × 33 \arcsec 44\arcsec\times 33\arcsec ). The corner brackets mark SN Helios. The dashed circle encloses the positions where the five lens models predict the next image of the SN to appear. Their predicted delays after the discovery epoch are 2.3 ± 0.4 2.3\pm 0.4 yr ( ALP ), 2.7 ± 0.5 2.7\pm 0.5 yr (Zitrin-analytic), 3.09 ± 1.01 3.09\pm 1.01 yr ( glafic ), 5.2 5.2 yr ( WSLAP+ ) and 6.0 6.0 yr ( LENSTOOL ), placing the reappearance between 2028 and 2032. The models agree on where the next image appears to within a few arcseconds. The spread in the predicted delays is primarily due to the scarcity of spectroscopic redshifts for the multiple-image systems rather than to differences between the modeling methods (Section 4 ). Right: 3 \arcsec × 3 \arcsec 3\arcsec\times 3\arcsec cutouts at the SN position, oriented north up and east left, comparing matched wavelengths across the three epochs on an identical surface-brightness scale, each at its native pixel scale. No source is present before the explosion (E0 F322W2), the SN appears at discovery (E1 F356W), and it has faded six weeks later (E2 F356W). The second DDT epoch is intrinsically shallower ( 773 773 s versus 1246 1246 s), which the shared scale makes visible. Bottom: the same cutouts in all ten VENUS bands at the discovery epoch, shown on a single common display scale, where the SN is undetected in F090W–F150W and clearly detected from F200W redward (Section 3.1 ).
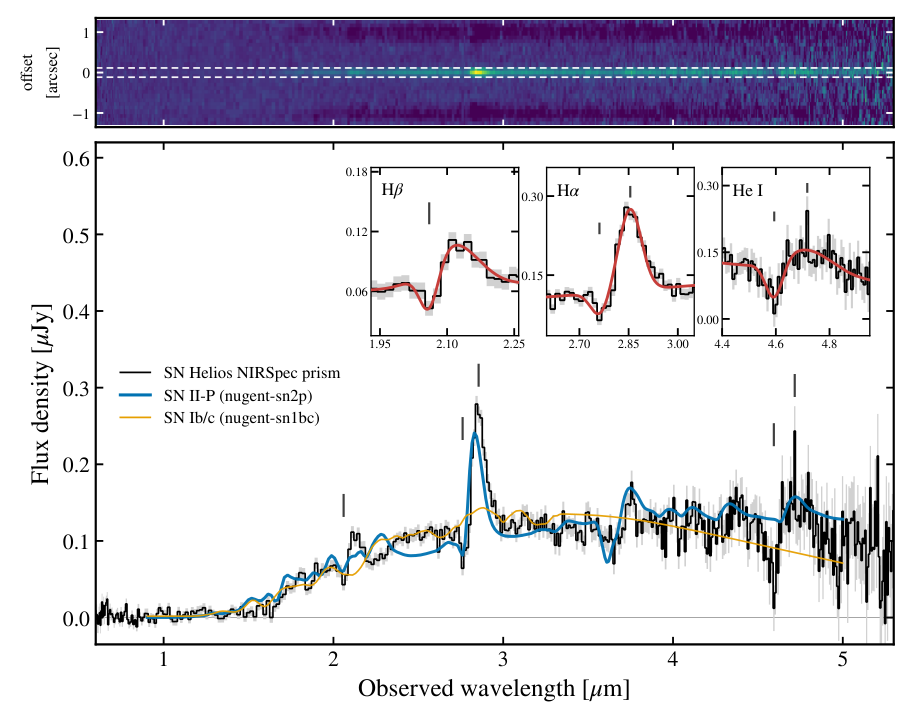
Tests the Type II classification by comparing the prism spectrum with forward-modelled templates and resolving the broad hydrogen P-Cygni features that hydrogen-poor templates fail to reproduce.
Original caption
Figure 2: JWST /NIRSpec S200A1 prism spectrum of SN Helios ( 13.1 13.1 ks, 2026 August 17; black with gray 1 σ 1\sigma band), with the best-fit Type IIP template (blue) and, for contrast, the best-fit stripped-envelope Ib/c template (orange), both forward-modeled through the wavelength-dependent prism line-spread function with the phase, host reddening, and amplitude free. The top panel shows the rectified two-dimensional spectrum; dashed lines mark the FWHM ( 0 . \arcsec 23 0\mbox{\kern 0.55974pt.\kern-4.09024pt\arcsec\kern-0.43057pt}23 ) of the fitted spatial profile used for the optimal extraction. The insets zoom on the H β \beta , H α \alpha , and He i λ \lambda 10830 features. The red curves show the best-fit P-Cygni profile with a linear continuum plus emission and absorption Gaussians. The hydrogen-rich templates are preferred over the stripped-envelope and thermonuclear alternatives at Δ χ 2 \Delta\chi^{2} of several hundred, driven by the broad H α \alpha emission that the hydrogen-poor templates cannot produce.
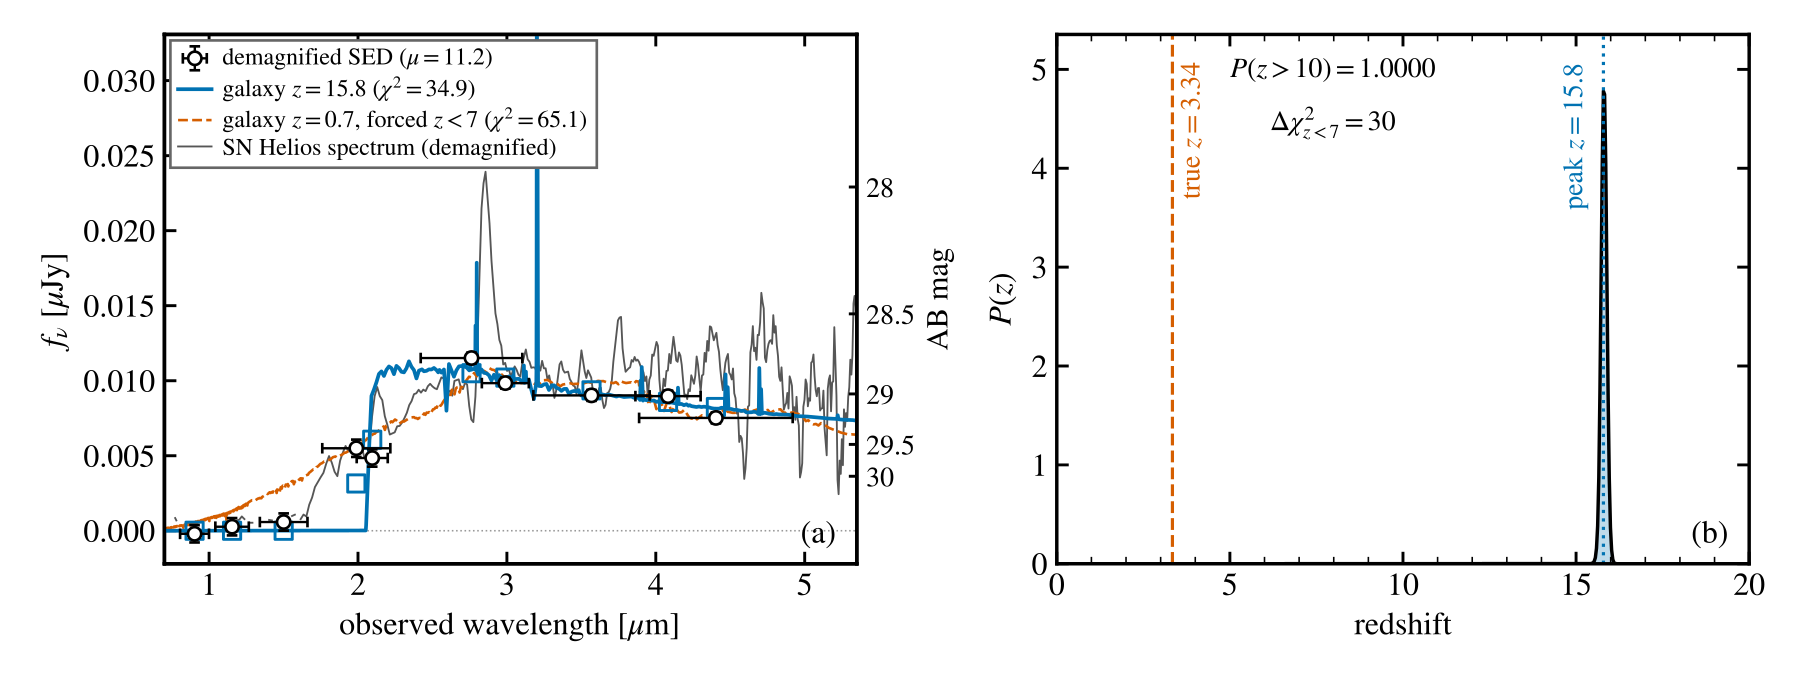
Tests dropout contamination: after demagnification, galaxy-only photometric fitting produces a single high-redshift peak near z≈16 despite the spectroscopic z=3.34 SN interpretation.
Original caption
Figure 6: The z ≈ 16 z\approx 16 impostor experiment. Left: the discovery-epoch SED of SN Helios demagnified by μ = 11.2 \mu=11.2 and evaluated at an assumed survey depth of 30.25 30.25 / 30.75 30.75 mag ( 5 σ 5\sigma , SW/LW); the fluxes are the exact demagnified measurements, with no synthetic noise added. Horizontal bars show the effective widths of the NIRCam filters; the right-hand axis marks the corresponding AB magnitudes (the nonuniform spacing follows from the linear flux axis). The best free-redshift galaxy template (blue, z = 15.8 z=15.8 ) and the best solution forced to z < 7 z<7 (orange dashed, z = 0.7 z=0.7 ) are shown, together with the demagnified NIRSpec spectrum of SN Helios (gray), the actual z = 3.34 z=3.34 SN that these photometric points represent. Right: the free-redshift photometric posterior of the demagnified SED, which is single-peaked at z ≃ 16 z\simeq 16 with P ( z > 10 ) > 0.9999 P(z>10)>0.9999 ; the best solution forced to z < 7 z<7 is disfavored at Δ χ 2 = 30.1 \Delta\chi^{2}=30.1 . Galaxy templates only, flat redshift prior; see Section 5.3 for the disclosed assumptions.
Related research
Previous digest
Fujimoto et al. report SN Helios, a strongly lensed, multiply imaged Type II supernova at z=3.34 behind RXC J0018.5+1626, discovered as a red JWST/NIRCam F150W dropout and confirmed with a deep NIRSpec prism spectrum. Broad Hα (FWHM about 7900 km s⁻¹), an 8800 km s⁻¹ blueshifted P-Cygni trough, Hβ, and He I λ10830 establish a hydrogen-rich photosphere, while template and light-curve fits place the event about 27.5 rest-frame days after B-band maximum. Lens models give μ≈10–20 and predict a further image in roughly 2–6 years, making this a prospective z>3 time-delay cosmography system. Crucially for high-redshift source selection, its transient SED would otherwise be convincingly fitted as a z≈16 Lyman-break galaxy, providing an empirical contaminant template for dropout searches; its unseen, intrinsically ultra-faint host also supports elevated core-collapse SN production per unit star formation in very low-luminosity galaxies.
Sources and evidence (22)
- 2609.30440v1: SN Helios: A Multiply Imaged Type II Supernova Opening Time-Delay Cosmography beyond redshift of 3
We report the discovery and spectroscopic confirmation of SN Helios, a strongly lensed, multiply imaged Type II supernova (SN) at $z=3.34$ behind the galaxy cluster RXC J0018.5+1626. The transient was identified as a red F150W-dropout source (F277W = 26.1 mag) in JWST/NIRCam imaging taken on 2026 July 3 for the VENUS survey, with no counterpart in 2024 December imaging. Director's Discretionary Time observations on 2026 August 17 added second-epoch NIRCam imaging and a deep NIRSpec prism spectrum. The spectrum shows a strong, spectrally resolved H$α$ emission line (FWHM $\approx 7900$ km/s) with a P-Cygni absorption blueshifted by 8800 km/s, together with corresponding H$β$ and He I $λ$10830 features, establishing a hydrogen-rich photosphere at $z=3.34$. Template fits classify SN Helios as a Type II SN, and light-curve comparisons with well-studied local SNe II yield a phase of $27.5\pm2.8$ rest-frame days past B-band maximum. Independent cluster lens models magnify the observed image by $μ\approx 10$-20 and predict another image within $\simeq 2$-6 yr, offering a rare opportunity for a time-delay measurement of $H_{0}$ with a source at $z>3$. The host galaxy is undetected in deep rest-frame ultraviolet and optical imaging, in emission lines, and in ALMA 2 mm dust continuum, leaving a heavily obscured counterpart unlikely. Its de-lensed $M_{\rm UV}\gtrsim -13$ places it far below blank-field limits and adds support to an elevated core-collapse rate per unit star formation in ultra-faint galaxies. Without the multi-epoch data, SN Helios would masquerade as a convincing $z\approx 16$ Lyman-break galaxy, with galaxy-template fits strongly disfavoring any low-redshift solution even with multiple medium bands. Its spectrum thus provides an empirical SED template with which high-redshift searches can vet similar dropout candidates.
- 2609.30440v1: SN Helios: A Multiply Imaged Type II Supernova Opening Time-Delay Cosmography beyond redshift of 3
The results of this procedure are explained in more detail in the Appendix (see Figure 7 ). It is clear that there are a wide range of phases at which a low χ ν 2 \chi^{2}_{\nu} value is recoverable, although there is a clear clustering of low χ ν 2 \chi^{2}_{\nu} values in the 20 − 30 20-30 day phase range. Due to the large scatter in values, it is difficult to ascertain an accurate uncertainty from this analysis, but the evidence from this comparison of H α \alpha alone points strongly to this phase range for SN Helios. Further spectroscopic observations of SN Helios when it reappears will allow for a re-analysis with more spectrosopic coverage and further permit a direct spectroscopic time-delay estimate as has been done for other strongly lensed SNe ( Johansson et al., 2021 ; Chen et al., 2024 ; Johansson et al., 2026 ) . Given this phase range, our spectrum of SN Helios is too early to perform a similar Fe II line analysis as was done with SN Eos to infer the gas-phase metallicity of its host environment ( Coulter et al., 2026a ) . Additionally, we lack the spectral resolution to resolve the Fe II 5018 and 5169 Å lines in the triplet; however, a reappearance of SN Helios could allow for this more in-depth analysis to be done in conjunction with fitting for a spectrophotometric time delay.
- 2609.30440v1: SN Helios: A Multiply Imaged Type II Supernova Opening Time-Delay Cosmography beyond redshift of 3
We have presented the discovery and spectroscopic confirmation of SN Helios, a strongly lensed Type II SN at z = 3.34 z=3.34 behind RXC J0018.5+1626, identified in VENUS multi-epoch NIRCam imaging and confirmed with a DDT NIRSpec prism spectrum showing broad H α \alpha , H β \beta , and He i λ \lambda 10830 P-Cygni features from a photosphere expanding at 7 7 – 9 × 10 3 9\times 10^{3} km s -1 . Comparing to local analogs, we recover a photometrically derived phase estimate for the spectroscopic epoch of 27.5 ± 2.8 27.5\pm 2.8 days, further corroborated by spectroscopic comparisons of the H α \alpha feature to the CSP sample of SNe II. Five independent lens models predict another image of the SN appearing 2 2 – 6 6 yr from now, making SN Helios the highest-redshift cosmologically-useful SN known and a realistic anchor for time-delay cosmography at z > 3 z>3 . The host galaxy is undetected down to a de-lensed M UV ≳ − 13 M_{\rm UV}\gtrsim-13 , fainter than any known CCSN host. And had it not been magnified, monitored, and spectroscopically unmasked, the discovery-epoch SED of SN Helios would stand today as a convincing z ≈ 16 z\approx 16 candidate; its spectrum now serves as an empirical template for vetting the dropout candidates of high-redshift galaxy searches, and we make it available with the EAZY template sets ( Brammer et al., 2008 ) 1 1 1 https://github.com/gbrammer/eazy-photoz .
- 2609.30440v1: SN Helios: A Multiply Imaged Type II Supernova Opening Time-Delay Cosmography beyond redshift of 3
Acknowledgments. SF acknowledges support from the Dunlap Institute, funded through an endowment established by the David Dunlap family and the University of Toronto, and from an NSERC discovery grant (RGPIN-2026-07931; DGECR-2026-00232). RAW acknowledges support from NASA JWST Interdisciplinary Scientist grants NAG5-12460, NNX14AN10G and 80NSSC18K0200 from GSFC. PD warmly acknowledges support from an NSERC discovery grant (RGPIN-2025-06182). KK acknowledges the support by JSPS KAKENHI Grant Numbers JP22H04939, JP23K20035, and JP24H00004. We acknowledge the support of the Canadian Space Agency (CSA) [25JWGO4A18].
- 2609.30440v1: SN Helios: A Multiply Imaged Type II Supernova Opening Time-Delay Cosmography beyond redshift of 3
Figure 8: Light curve matches for SN 1999em and SN 2005cs, the analysis methodology behind which is described in Section 3.4 , and the assumptions in the fits described in Table 4 . The measured phase of the resulting fits are 30.3 ± 5.2 30.3\pm 5.2 and 26.4 ± 4.6 26.4\pm 4.6 days relative to the B -band maximum for SN 1999em and SN 2005cs, respectively. Despite the clearly shallower evolution in their light curves, these results are still consistent with SN 2013ej within 1 σ 1\sigma and with the spectroscopic estimate.
- 2609.30440v1: SN Helios: A Multiply Imaged Type II Supernova Opening Time-Delay Cosmography beyond redshift of 3
We report the discovery and spectroscopic confirmation of SN Helios, a strongly lensed, multiply imaged Type II supernova (SN) at z = 3.34 z=3.34 behind the galaxy cluster RXC J0018.5+1626. The transient was identified as a red F150W-dropout source (F277W = 26.1 =26.1 mag) in JWST /NIRCam imaging taken on 2026 July 3 for the VENUS survey, with no counterpart in 2024 December imaging of the same field. Director’s Discretionary Time observations on 2026 August 17 added second-epoch NIRCam imaging and a deep NIRSpec prism spectrum. The spectrum shows a strong, spectrally resolved H α \alpha emission line (FWHM ≈ 7900 \approx 7900 km s -1 ) with a P-Cygni absorption blueshifted by 8800 8800 km s -1 , together with corresponding H β \beta and He i λ \lambda 10830 features, establishing a hydrogen-rich photosphere at z = 3.34 z=3.34 . Template fits that forward-model the prism resolution classify SN Helios as a Type II SN, and light-curve comparisons with well-studied local SNe II yield a phase of 27.5 ± 2.8 27.5\pm 2.8 rest-frame days past B -band maximum. The 0.9 mag drop in the rest-frame B band over 10 rest-frame days most likely reflects post-peak photospheric evolution driven by radioactive heating, rather than a hydrogen recombination-driven plateau or its fall-off. Independent cluster lens models magnify the observed image by μ ≈ 10 \mu\approx 10 –20 and predict another image within ≃ 2 \simeq 2 –6 yr, offering a rare opportunity for a time-delay measurement of H 0 H_{0} with a source at z > 3 z>3 . The host galaxy is undetected in deep rest-frame ultraviolet and optical imaging, in emission lines, and in ALMA 2 mm dust continuum, leaving a heavily obscured counterpart unlikely. Its de-lensed M UV ≳ − 13 M_{\rm UV}\gtrsim-13 places it far below blank-field limits and adds support to an elevated core-collapse rate per unit star formation in ultra-faint galaxies. Without the multi-epoch data, SN Helios would masquerade as a convincing z ≈ 16 z\approx 16 Lyman-break galaxy, with galaxy-template fits strongly disfavoring any low-redshift solution even with multiple medium bands. Its spectrum thus provides an empirical SED template with which high-redshift searches
- 2609.30440v1: SN Helios: A Multiply Imaged Type II Supernova Opening Time-Delay Cosmography beyond redshift of 3
Figure 2 presents the prism spectrum, which shows a red continuum ( ≃ 0.11 μ \simeq 0.11\,\mu Jy, 26.4 26.4 mag at 3 3 – 5 5 μ \mu m) with a strong emission line at 2.855 2.855 μ \mu m detected at S / N ≃ 24 {\rm S/N}\simeq 24 . Interpreting the line as H α \alpha places the emission peak at z = 3.350 z=3.350 ; for a broad P-Cygni profile the emission peak does not generally coincide with the systemic wavelength. An alternative identification as [O iii ] λ 5007 \lambda 5007 at z = 4.70 z=4.70 is disfavored on several grounds. The line is spectrally resolved and carries a blueshifted absorption trough (Section 2.1.2 ), whereas [O iii ] is a forbidden transition from low-density gas that produces neither a ∼ 8000 \sim 8000 km s -1 width nor a P-Cygni profile. At z = 4.70 z=4.70 H β \beta would fall at 2.77 2.77 μ \mu m, where the spectrum instead shows a deep absorption trough, so the implied [O iii ] λ 5007 \lambda 5007 /H β \beta and H α \alpha /H β \beta ratios are negative and no H ii region can reproduce them. The weak feature near 3.76 3.76 μ \mu m that would then be H α \alpha is instead matched by the Ca ii near-infrared triplet at z = 3.34 z=3.34 . We also perform an independent, empirical cross-check by fitting the prism spectrum of SN Eos at z = 5.13 z=5.13 ( Coulter et al., 2026a ; Asada et al., 2026 , DD 9493;) , the only CCSN with a high signal-to-noise prism spectrum at a comparable redshift, so that the rest-frame coverage and the wavelength-dependent line-spread function match those of SN Helios, as a template with only redshift and normalization free; the best match is at z = 3.338 z=3.338 (Appendix C ). We adopt z = 3.34 z=3.34 throughout this paper, and all line velocities are quoted relative to the systemic wavelengths at this redshift. Because the redshift derives from broad SN lines rather than narrow host lines, we evaluate a systematic uncertainty of Δ z ≃ 0.01 \Delta z\simeq 0.01 .
- 2609.30440v1: SN Helios: A Multiply Imaged Type II Supernova Opening Time-Delay Cosmography beyond redshift of 3
The 2.855 2.855 μ \mu m line feature is spectrally resolved. The observed FWHM of 810 810 Å compares to the instrumental resolution of 310 310 Å at this wavelength ( R = 92 R=92 ), giving an intrinsic FWHM ≈ 7900 {\rm FWHM}\approx 7900 km s -1 . A P-Cygni absorption trough is robustly detected at 2.761 2.761 μ \mu m with the 5.5 σ 5.5\sigma level, blueshifted from systemic H α \alpha by 8800 ± 500 8800\pm 500 km s -1 . The corresponding H β \beta absorption is also present at 2.060 2.060 μ \mu m, blueshifted by 7100 ± 1500 7100\pm 1500 km s -1 , and a He i λ \lambda 10830 P-Cygni profile is further detected at 4.59 / 4.72 4.59/4.72 μ \mu m, blueshifted by 6800 ± 500 6800\pm 500 km s -1 . Within the prism resolution and its lower signal-to-noise, H β \beta shows the same P-Cygni profile as H α \alpha , with the two absorption velocities separated by 1600 ± 1600 1600\pm 1600 km s -1 , consistent with the H α \alpha –H β \beta velocity hierarchy of local SNe II at this phase ( Gutiérrez et al., 2017a , ≃ 700 \simeq 700 – 900 900 km s -1 at + 23 +23 – 28 28 d;) . These features describe a single photosphere expanding at 7 7 – 9 × 10 3 9\times 10^{3} km s -1 with a substantial hydrogen envelope, which establishes SN Helios as a Type II SN independent of any template fitting and which is consistent with the local sample of SNe II at earlier phases ( Gutiérrez et al., 2017a , see Sec. 3.3 for a more detailed discussion,) .
- 2609.30440v1: SN Helios: A Multiply Imaged Type II Supernova Opening Time-Delay Cosmography beyond redshift of 3
Table 5: Cluster lens-model predictions for the reappearance of SN Helios. “Constraints” lists the number of multiple images and sources used by each model (see text). Δ RMS \Delta_{\rm RMS} is the image-plane reproduction error and N img N_{\rm img} the total number of SN images the model predicts. The SN Helios column gives the magnification of the observed image, and the last three columns give the predicted position, the delay relative to the observed image, and the magnification of the next image to arrive. Uncertainties are statistical (68%).
- 2609.30440v1: SN Helios: A Multiply Imaged Type II Supernova Opening Time-Delay Cosmography beyond redshift of 3
Three properties make this system a promising cosmological tool. First, the predicted reappearance on a 1.5 1.5 – 3 3 yr timescale is long enough in the future to plan for, yet a short enough window to monitor. Publishing the model forecasts before the reappearance follows the precedent set for SN Refsdal and SN Requiem, whose predicted fourth image (“in the year 2037 ± \pm 2”) was announced at discovery ( Rodney et al., 2021 ) , and turns the reappearance itself into a falsifiable test of the lens models. Second, a Type IIP light curve provides a sharp clock. The plateau-to-drop off transition occurs over a few rest-frame weeks, which at z = 3.34 z=3.34 stretches to a few observer-frame months, and catching this feature in both the current and the future images would substantially tighten the delay measurement relative to a featureless light curve. Third, SNe IIP allow for independent luminosity-distance estimates through the expanding-photosphere and standardizable-candle methods ( Kirshner & Kwan, 1974 ; Hamuy & Pinto, 2002 ) , which can constrain the absolute magnification of the SN and thereby address the mass-sheet degeneracy that limits purely geometric time-delay constraints. Fortunately, the immediate next steps are in hand. The scheduled third NIRCam epoch in 2026 November–December will catch the plateau or its end, and the upcoming Keck /KCWI spectroscopy of the cluster core will secure the multiple-image redshifts that currently limit both lens models. Additional deep imaging can pursue the host at the SN and counter-image positions. Given the current dataset for this image and the already auspicious uncertainty on its phase on the order of a few days, we estimate that a successful reappearance campaign could eventually reach an inference on H 0 H_{0} competitive to the 2 − 4 % 2-4\% achieved for the current cluster lensed SNe Refsdal, H0pe, Encore, and Requiem, once the scheduled spectroscopy secures the multiple-image redshifts and the lens models converge.
- 2601.06015v1: VENUS: Two Faint Little Red Dots Separated by $\sim70\,\mathrm{pc}$ Hidden in a Single Lensed Galaxy at $z\sim7$
Figures 3 , 4 , and 5 , show the SED-fitting results for each component. The photometric redshifts of the individual components are generally consistent at z ∼ 7.4 z\sim 7.4 . The BAGPIPES fits that include a blackbody component reproduce both the blue UV continuum and the red optical continuum observed in the LRD images. Without this component, the best-fit solutions require dusty star-forming galaxy templates to match the red optical continuum, which in turn leads to a significant underestimate of the UV flux. In contrast, the SFG components are well-explained by young star-forming galaxy models. We note that the fits to the SFG images with and without the blackbody component yield nearly identical best-fit SEDs, implying little contribution from the blackbody component. For the LRD images, the best-fit T BB T_{\mathrm{BB}} values are ∼ 4000 – 4500 K \sim 4000\text{--}4500\,\mathrm{K} , which are slightly lower than theoretical predictions of ∼ 5000 K \sim 5000\,\mathrm{K} from the black hole envelope models [ 45 , 40 ] but consistent with the JWST/PRISM spectroscopy demographic study of de Graaff et al. [20] .
- 2601.06015v1: VENUS: Two Faint Little Red Dots Separated by $\sim70\,\mathrm{pc}$ Hidden in a Single Lensed Galaxy at $z\sim7$
In this work, we present the detection of a very close pair of LRDs found in a strongly lensed galaxy and separated by ∼ 70 pc \sim 70\,\mathrm{pc} , which are embedded in the typical SFGs at z ∼ 7 z\sim 7 . The main findings in this work are summarized below:
- 2502.07875v1: Investigating photometric and spectroscopic variability in the multiply-imaged Little Red Dot A2744-QSO1
A&A proofs: manuscript no. main Table 3. JWST/NIRSpec emission line results for each image of A2744- QSO1 in each epoch of available spectroscopy (see Tab. 2). The line fluxes and underlying continuum flux densities are de-magnified, but the EWs are independent of magnification. Line Image A Image B Image C Epoch 7 Epoch 8 EW0 [Å] Hβ 48+2 −2 53+4 −4 50+2 −2 62+5 −5 Hα 285+7 −6 289+9 −8 307+4 −5 346+11 −11 Fline [10−19 erg cm−2 s−1] Hβ 2.7 ± 0.2 2.9 ± 0.3 2.4 ± 0.3 2.9 ± 0.3 Hα 20.2 ± 0.8 24.7 ± 1.1 18.3 ± 1.4 24.7 ± 1.1 fλ,continuum [10−22 erg cm−2 s−1 Å−1] Hβ 6.9 ± 0.3 6.7 ± 0.3 5.6 ± 0.2 4.8 ± 0.4 Hα 8.8 ± 0.3 10.6 ± 0.4 6.7 ± 0.2 6.6 ± 0.5 −800 −600 −400 −200 0 200 ∆t0 [d] 45 50 55 60 65 70 EW0 [˚A] Image A – Hβ Image B – Hβ Image C – Hβ −6000 −4000 −2000 0 2000 ∆tobs [d] 280 300 320 340 360 EW0 [˚A] Image A – Hα Image B – Hα Image C – Hα Fig. 2. Spectroscopic variability of A2744-QSO1 as a function of time, with image A shown in blue, image B in red, and image C in green as in Fig. 3. –Top: Hβ rest-frame EW, presenting a drop of 22 ± 8 % between images C and A. –Bottom: Hα rest-frame EW, presenting a drop of 18± 3 % in the time between images C and A. We note that the variability is consistent in both broad Balmer lines, as can be expected since they both originate from the broad-line region of A2744-QSO1. The EWs represent excellent indicators of variability since they are insensitive to most systematics such as lensing, slit-losses, calibration, etc. absolute line fluxes, the EWs are neither prone to lensing nor instrumental systematics (e.g. slit-losses), which is why we use them as the primary and most robust indicators of variability (see also Ji et al. 2025). As can be seen in Fig. 2, both Hα and Hβ show a consistent variability in their EW over time2. More quan- titatively, we note a drop in EW of 18 ± 3 % in Hα and 22 ± 8 % in Hβ between the times probed by image C and image A (in both its epochs). The absolute calibration of the red edge of the 2 Here and throughout this letter, we define the time axis in days rel- ative to the UNCOVER imaging (epoch 2 at MJD = 59890.23, see Tab. 2). The relative time is then obtained by adding the difference be- tw
- 2502.07875v1: Investigating photometric and spectroscopic variability in the multiply-imaged Little Red Dot A2744-QSO1
tics estimated for these magnification values can reach ∼40 % (Zitrin et al. 2015). However, the exact level does not affect the conclusions of this work. Article number, page 3 of 11
- 2504.17007v1: The First Photometric Evidence of a Transient/Variable Source at z>5 with JWST
The James Webb Space Telescope (JWST) discovered 79 transients out to $z$$\sim$4.8 through the JADES Transient Survey (JTS), but the JTS did not find any $z$$>$5 transients. Here, we present the first photometric evidence of a $z$$>$5 transient/variable source with JWST. The source, AT 2023adya, resides in a $z_{\mathrm{spec}}$$=$5.274 galaxy in GOODS-N, which dimmed from $m_{\rm F356W}$$=$26.05$\pm$0.02 mag to 26.24$\pm$0.02 mag in the rest-frame optical over approximately two rest-frame months, producing a clear residual signal in the difference image ($m_{\rm F356W}$$=$28.01$\pm$0.17 mag; SN$_\mathrm{var}$$=$6.09) at the galaxy center. Shorter-wavelength bands (F090W/F115W) show no rest-frame ultraviolet brightness change. Based on its rest-frame V-band absolute magnitude of M$_\mathrm{V}$$=$$-$18.48 mag, AT 2023adya could be any core-collapse supernova (SN) subtype or an SN Ia. However, due to low SN Ia rates at high redshift, the SN Ia scenario is unlikely. Alternatively, AT 2023adya may be a variable active galactic nucleus (AGN). However, the JWST NIRCam/Grism spectrum shows no broad H$α$ emission line (FWHM$=$130$\pm$26 km s$^{-1}$), disfavoring the variable AGN scenario. It is also unlikely that AT 2023adya is a tidal disruption event (TDE) because the TDE models matching the observed brightness changes have low event rates. Although it is not possible to determine AT 2023adya's nature based on the two-epoch single-band photometry alone, this discovery indicates that JWST can push the frontier of transient/variable science past $z$$=$5 and towards the epoch of reionization.
- 2512.05180v1: Little red dot variability over a century reveals black hole envelope via a giant Einstein cross
"Little red dots" (LRDs) represent a new population of astronomical objects uncovered by JWST whose nature remains debated. Although many LRDs are suspected as active galactic nuclei (AGN), they show little variability on days-years timescales. We report the discovery of two gravitationally lensed LRDs at redshift $\sim$4.3 behind the cluster RXCJ2211-0350, one of which (RX1) is quadruply imaged with time delays spanning $\sim$130 years. RX1 exhibits intrinsic color and brightness variations of up to 0.7 magnitude among its images. These changes are consistent with blackbody-temperature variations of a photosphere, indicating long-term variability analogous to Cepheid-like pulsations but in a far more extended ($R \sim 2000$ AU) and massive ($M \gtrsim 10^6 \, M_{\odot}$) systems. These results suggest LRDs as a distinct class of AGN with stellar-like envelopes.
- 2512.02117v1: VENUS: When Red meets Blue -- A multiply imaged Little Red Dot with an apparent blue companion behind the galaxy cluster Abell 383
This paper is organized as follows: The data are described in section 2 . In section 3 , we present the object, and the photometric and SL analysis. In section 4 , we discuss our results for both the LRD candidate and its blue companion, and in section 5 we give a brief summary and conclusion. Throughout this work, we use a flat Λ \Lambda CDM cosmology with H 0 = 70 H_{0}=70 km s -1 Mpc -1 , Ω Λ = 0.7 \Omega_{\Lambda}=0.7 , and Ω m = 0.3 \Omega_{\mathrm{m}}=0.3 , and use AB magnitudes ( Oke and Gunn, 1983 ) . Errors are typically 1 σ 1\sigma unless noted otherwise.
- 2512.02117v1: VENUS: When Red meets Blue -- A multiply imaged Little Red Dot with an apparent blue companion behind the galaxy cluster Abell 383
Figure 3: Photometry and SED-modeling of A383-LRD1 image A, with composite-color image cutouts on the right. The de-magnified observed fluxes are shown in blue, with 2 σ 2\sigma upper limits in the case of a non-detection. The best-fit (maximum-a-posteriori) fluxes are shown in red, and the best-fit SED in black. Top : Bagpipes LRD fit to the LRD component. The LRD SED model comprises a BH*-AGN component shown in red, and a host galaxy shown in purple. We also show the BEAGLE DSFG fit as the orange dotted line. Bottom: BEAGLE star-forming galaxy fit to the blue companion.
- 2607.00093v1: Search for Quasar Pairs with ${\it Gaia}$ Astrometric Data. III. Discovery of 9 dual and projected quasars
We report the low-resolution long-slit spectroscopic observations and confirmations of 11 quasar pair candidates, which are selected from the MGQPC catalog presented in the first paper of our series work (hereafter, Paper-I) and the early version of this catalog. The spectroscopic follow-up was carried out with 5 spectrographs equipped on 3 telescopes, and the major discoveries include 6 dual quasars and 3 projected quasars. One of the dual quasars has a high redshift of $\sim$ 3.1. The LQ hypothesis of 3 dual quasars cannot be completely ruled out. We investigated the reason why previous spectroscopic surveys missed several new quasars. We discussed a projected quasar with a wide-separation lensing configuration, as well as two quasar-star projections that mimic the configuration of lensed quasars. The photometric redshifts for the 11 observed candidates were extracted from the second paper of our series work (hereafter, Paper-II) to illustrate their positive role in mitigating contamination from projected quasars and quasar-star projections. We also reviewed and discussed the confirmation strategies for dual and lensed quasar candidates, and outlined future confirmation strategies for them in the context of the era dominated by large-scale spectroscopic and imaging surveys.
- 2509.09607v1: Discovery of Multiply Ionized Iron Emission Powered by an Active Galactic Nucleus in a z~7 Little Red Dot
Some of the most puzzling discoveries of NASA's JWST in the early Universe surround the surprising abundance of compact red sources, which show peculiar continuum shapes and broad hydrogen spectral lines. These sources, dubbed ``Little Red Dots'' or LRDs, have been the subject of intense inquiry in the literature. Any of the proposed explanations, from accreting super-massive black holes ensconced in ultra-dense gas to extremely compact star-systems, has significant implications for the earliest phases of galaxy evolution. Part of the difficulty in concretely identifying the physical mechanisms that drive their rest ultra-violet/optical spectral properties is the lack of bona fide signatures -- either star-formation or accreting super-massive black hole, that uniquely discriminate between competing interpretations. In this work, we report the discovery of several spectral features that strongly favor the existence of an accreting super-massive black hole in an LRD witnessed in the first 800 Myr of cosmic time, including several rare iron transitions and a possible [FeVII]. Additionally, we report on the properties of significant Balmer absorption and find that the small widths and relative depths of the absorption feature suggest the source of the absorber is at or beyond the outer edge of the broad-line region and does it fully cover the accreting SMBH in the center of the system. The detection of these iron features, coupled with the properties of the Balmer absorption, unveils an alternative scenario for LRDs -- one where there are direct sight-lines from the accretion disk to gas on scales at (or beyond) the broad-line gas region.
- 2608.20781v1: Pandora cluster Lensing, AGN, and Transient Exploration (PLATE) from JWST Multi-Epoch Imaging. I. Discovery of a type II supernova candidate in a spiral galaxy at $z=0.7$
In this paper, we present the first PLATE result: PLATE-23a, a supernova at redshift z = 0.688 z=0.688 with extensive multi-epoch, multi-filter observations. The paper is organized as follows. Section 2 describes the multi-epoch NIRCam observations of Abell 2744; then outlines the image reduction process, the difference-imaging strategy, and the selection and photometry of the SN object. In Section 3 , we discuss the host galaxy properties and the classification of PLATE-23a. Section 4 summarizes our conclusions. Throughout this work, we express magnitudes using the AB system [ 60 ] and assume a Λ \Lambda CDM cosmology with parameters Ω m \Omega_{m} = 0.3, Ω Λ \Omega_{\Lambda} = 0.7 and H 0 H_{0} = 70 km s − 1 \text{s}^{-1} Mpc − 1 \text{Mpc}^{-1} .
- 2608.20781v1: Pandora cluster Lensing, AGN, and Transient Exploration (PLATE) from JWST Multi-Epoch Imaging. I. Discovery of a type II supernova candidate in a spiral galaxy at $z=0.7$
Figure 1: Difference imaging of the PLATE-23a in the F444W filter, produced with HOTPANTS . From left to right, the original cutout images at two different epochs and the HOTPANTS resulting difference image. The top and bottom rows illustrate the brightening and fading phases of the SN, respectively. Owing to the large photometric variation, both processes are clearly identified in the difference image. The position of the SN and a 1” scale bar are marked in the figure.
Abstract
We report the discovery and spectroscopic confirmation of SN Helios, a strongly lensed, multiply imaged Type II supernova (SN) at $z=3.34$ behind the galaxy cluster RXC J0018.5+1626. The transient was identified as a red F150W-dropout source (F277W = 26.1 mag) in JWST/NIRCam imaging taken on 2026 July 3 for the VENUS survey, with no counterpart in 2024 December imaging. Director's Discretionary Time observations on 2026 August 17 added second-epoch NIRCam imaging and a deep NIRSpec prism spectrum. The spectrum shows a strong, spectrally resolved H$α$ emission line (FWHM $\approx 7900$ km/s) with a P-Cygni absorption blueshifted by 8800 km/s, together with corresponding H$β$ and He I $λ$10830 features, establishing a hydrogen-rich photosphere at $z=3.34$. Template fits classify SN Helios as a Type II SN, and light-curve comparisons with well-studied local SNe II yield a phase of $27.5\pm2.8$ rest-frame days past B-band maximum. Independent cluster lens models magnify the observed image by $μ\approx 10$-20 and predict another image within $\simeq 2$-6 yr, offering a rare opportunity for a time-delay measurement of $H_{0}$ with a source at $z>3$. The host galaxy is undetected in deep rest-frame ultraviolet and optical imaging, in emission lines, and in ALMA 2 mm dust continuum, leaving a heavily obscured counterpart unlikely. Its de-lensed $M_{\rm UV}\gtrsim -13$ places it far below blank-field limits and adds support to an elevated core-collapse rate per unit star formation in ultra-faint galaxies. Without the multi-epoch data, SN Helios would masquerade as a convincing $z\approx 16$ Lyman-break galaxy, with galaxy-template fits strongly disfavoring any low-redshift solution even with multiple medium bands. Its spectrum thus provides an empirical SED template with which high-redshift searches can vet similar dropout candidates.
Discussion
Discussion access requires a security token. Register for the weekly digest.