2610.28735v1 · First listed 2026-10-22
Discovery of a Broad-Line Active Galactic Nucleus at $z = 9.98$
A systematic JWST/NIRSpec search identifies MoM-BL-z10 at z=9.9837 as a candidate broad-line AGN. Its marginal-but-model-preferred broad Hβ enables a virial black-hole estimate, while alternative LRD assumptions shift the inferred mass substantially. [1][3][6]
Evidence
The authors searched archival JWST/NIRSpec PRISM spectra for 1,247 objects at 6.0≤z≤10.3, without photometric pre-selection, and identify MoM-BL-z10 at z=9.9837±0.0009. They fit Hβ with narrow and broad Gaussians, constraining the narrow profile with [O III] λ4960; the two-component model is preferred over narrow-only by ΔBIC=−15.55. Broad Hβ has S/N=3.87, FWHM=3480(+2040/−950) km s−1, and luminosity 1.25(+0.33/−0.31)×10^42 erg s−1. Compact F444W morphology plus [Ne III], [O III], and AGN-like [O II]-FLR/OHNO line ratios provide convergent, rather than independent definitive, support for an AGN interpretation. Using L5100, broad-Hβ width, a single-epoch virial calibration, and a standard quasar bolometric correction yields MBH=3.59(+5.79/−1.71)×10^7 M⊙ and λEdd=0.11(+0.10/−0.07). [1][3][4][6]
Earlier work
A concrete preceding comparison is CAPERS-LRD-z9, reported at z=9.288 with broad Hβ FWHM=3525±589 km s−1. MoM-BL-z10 therefore extends the reported broad-line-AGN redshift frontier by Δz≈0.70, while its nominal Hβ width is consistent within the large MoM-BL-z10 uncertainty. Earlier work also flags substantial systematic uncertainty in black-hole and host inferences for LRDs, rather than establishing a unique physical interpretation for their red continua. [21][22]
What changes
The paper’s principal advance is an Hβ-based virial mass estimate for a broad-line AGN at z≈10, observed when the Universe was 470 Myr old. The authors also test an explicitly conditional LRD scenario: adopting an LRD-specific bolometric correction and imposing λEdd=1 gives MBH≈2.1×10^6 M⊙, not an independent mass measurement. The reported UV/optical slopes and tentative F770W detection (S/N=3.3) make the source LRD-like, but do not demonstrate that it belongs to a distinct LRD population. [5][6][8]
Limits and open questions
The broad-line result is low significance (S/N=3.87) with highly asymmetric, large FWHM uncertainty, and Hβ lies near the long-wavelength edge of PRISM coverage; Hα confirmation is difficult with MIRI sensitivity. The LRD classification is tentative: βopt=0.94±0.83 and F770W is only a 3.3σ detection. Line-diagnostic uncertainties include a 0.20-dex term for possible [Ne III] blending. The virial result depends on single-epoch calibration and bolometric correction; the alternative LRD value additionally assumes Eddington-limited accretion. The supplied excerpts do not provide the survey completeness or selection function needed to infer prevalence. [5][7][9][6]
The core measurements are supported by extracted HTML conclusion blocks and the abstract; supplied figure captions provide figure intent but not full fitting, calibration, or completeness methodology. The survey’s full description is stated to be in preparation.
Key figures
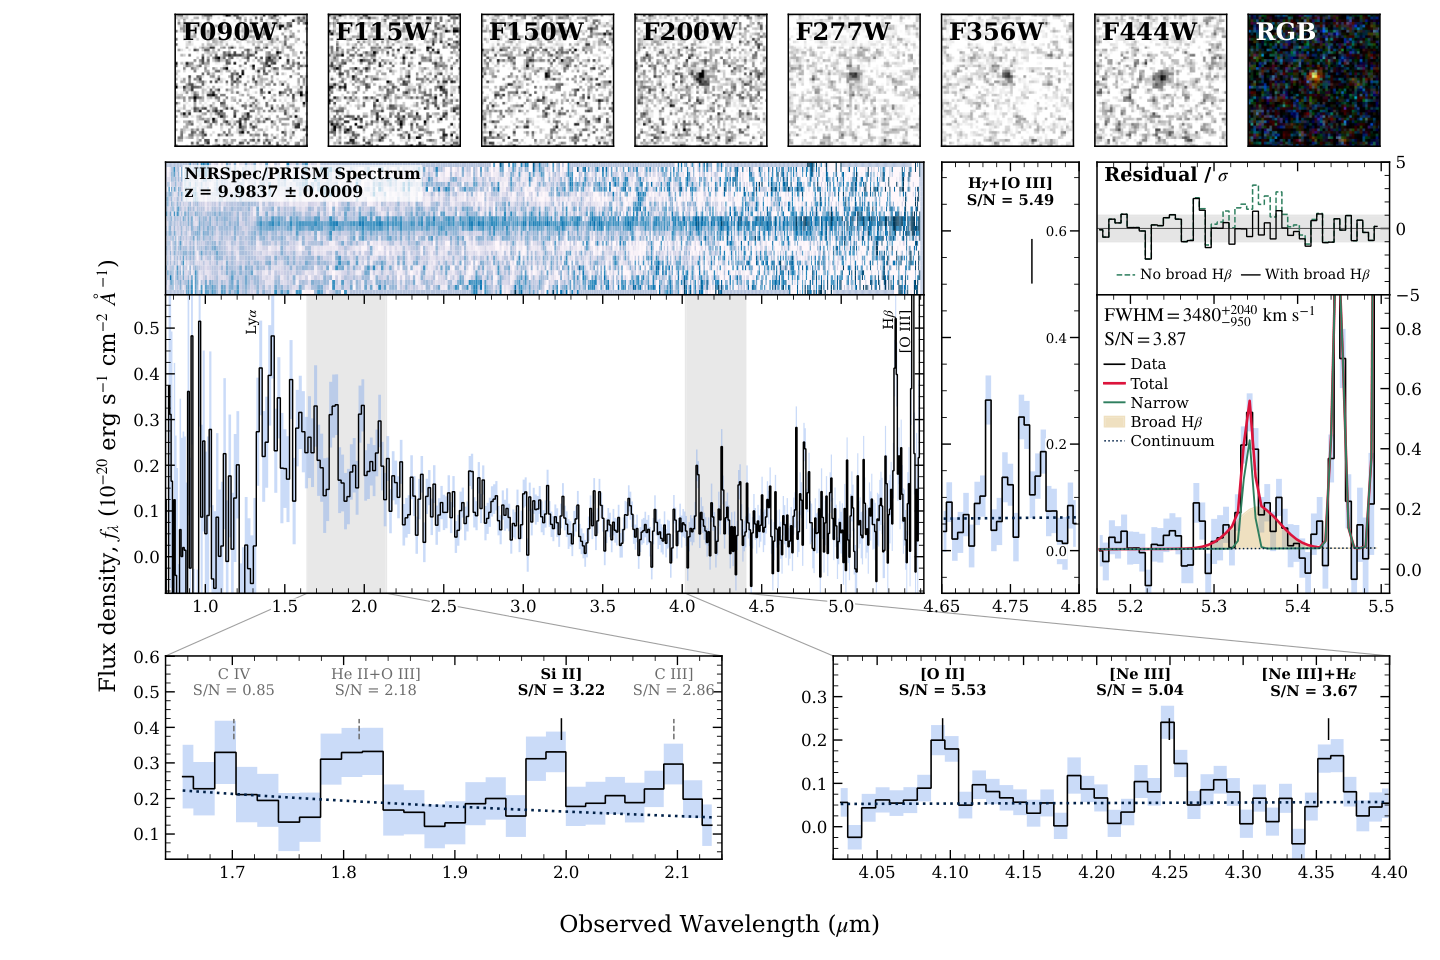
Tests whether the spectral feature is better represented by narrow plus broad Hβ than narrow emission alone, while showing the imaging compactness and the quoted 1σ spectral uncertainty band.
Original caption
Figure 1 : JWST spectroscopy and imaging of MoM-BL-z10. The top row shows 2 × 2 2\times 2 arcsec 2 cutout images in 7 NIRCam broadbands from F090W to F444W. The rightmost panel shows a pseudo-color image (blue: F090W+F115W+F150W; green: F200W+F277W; red: F356W+F444W). The middle panels show the 2D and 1D NIRSpec/PRISM spectra. In the 2D spectrum, positive and negative signals are shown in blue and white, respectively. The blue shaded region in the 1D spectrum indicates 1 σ 1\sigma uncertainties. The positions of Ly α \alpha and H β \beta +[O III] are marked. The right-hand panels show the H γ \gamma +[O iii ] λ 4364 \lambda 4364 and the H β \beta +[O iii ] complex regions. In the H β \beta +[O iii ] panel, we show the narrow+broad Gaussian fit to H β \beta . The upper inset shows the normalized residuals for fits with and without the broad H β \beta component. The bottom panels show zoomed-in views of weaker emission-line features, with labels in black for detections with S/N ≥ 3 \geq 3 and in gray for features with S/N < 3 <3 .

Tests the excitation-based AGN interpretation against SDSS AGN and star-forming loci. It propagates line-flux errors and adds 0.20 dex to [Ne III]/[O II] for possible blends.
Original caption
Figure 3 : The [O ii ]-FLR (left) and OHNO (right) diagnostics. The yellow star shows MoM-BL-z10, where we infer the [O iii ] λ 5008 \lambda 5008 from the [O iii ] λ 4960 \lambda 4960 flux by assuming a fiducial flux ratio of 2.98, and only the narrow H β \beta component is used. The error bars reflect the propagated 1 σ 1\sigma measurement uncertainties of the emission-line fluxes. An additional 0.20-dex uncertainty is added in quadrature to log ( [ Ne III ] / [ O II ] ) \log([\mathrm{Ne~III}]/[\mathrm{O~II}]) to account for possible blending with H η \eta , H ζ \zeta , and He I λ 3889 \lambda 3889 [ 90 , e.g.,] . Blue points show the SDSS AGN sample selected from BPT and [Ne v ] λ 3426 \lambda 3426 emission in the Portsmouth SDSS galaxy-property catalogue [ 22 ] ; orange contours indicate 50, 70, and 90% of the density of low-redshift BPT-selected MPA–JHU SF galaxies from the MPA–JHU catalogue of SDSS DR8 galaxy spectra [ 12 , 42 ] . Other symbols represent high-redshift ( z > 5 z>5 ) JWST AGNs published in the literature [ 91 , 89 , 92 , 64 , 90 , 7 ] . The arrow in the left panel indicates the effect of dust attenuation corresponding to E ( B − V ) = 0.2 E(B-V)=0.2 mag, assuming the attenuation law of Calzetti et al. [13] .

Tests illustrative growth requirements by comparing the two conditional mass estimates with continuous fixed-Eddington-ratio tracks for light and heavy seeds; it is a model exercise, not a reconstruction of the accretion history.
Original caption
Figure 5 : Illustrative black hole growth tracks of MoM-BL-z10 as a function of redshift assuming continuous accretion at fixed Eddington ratios with 10% radiative efficiency. The yellow star shows the fiducial virial SMBH mass of MoM-BL-z10, while the white star shows the LRD-based SMBH mass estimate assuming Eddington-limited accretion. The yellow stripe shows the backward extrapolation of the fiducial BH mass, assuming the observed Eddington ratio of λ Edd = 0.1 \lambda_{\mathrm{Edd}}=0.1 . The orange and blue stripes show the expected growth curves from a heavy ( 10 4 − 5 M ⊙ 10^{4-5}~M_{\odot} ) and a light (10–100 M ⊙ M_{\odot} ) seed BH, respectively, assuming continuous Eddington-limited accretion ( λ Edd = 1 \lambda_{\rm Edd}=1 ) beginning at z = 25 z=25 . The widths of these stripes correspond to their seed mass ranges. The lighter, hatched blue stripe shows the same light-seed track for a super-Eddington accretion case ( λ Edd = 2 \lambda_{\rm Edd}=2 ). Other symbols show known high-redshift quasars and AGNs in the literature; z ∼ 7.5 z\sim 7.5 luminous quasars [ 96 , 9 , 101 , diamonds;] , Euclid quasars [ 100 , pentagons;] , and JWST AGNs shown in Figure 4 with the same symbols. UHZ1 is shifted by Δ z = + 0.6 \Delta z=+0.6 from its spectroscopic redshift for clarity. For the Euclid quasars, black hole masses are estimated from their bolometric luminosities assuming λ Edd = 0.25 \lambda_{\rm Edd}=0.25 , the median value of the comparably luminous z ∼ 6 z\sim 6 quasars [ 72 ] .
Related research
Previous digest
Cai et al. report MoM-BL-z10, a z=9.9837 broad-line AGN found in a systematic, color-independent search of 1,247 robust z≥6 JWST/NIRSpec PRISM redshifts from the DAWN archive. Its Hβ+[O III] complex contains a tentative but significant broad Hβ component (S/N=3.87; FWHM ≈3480 km s⁻¹), while [Ne III] detection and elevated [Ne III]/[O II] and [O III]/Hβ ratios strengthen the AGN interpretation; its compact morphology and UV-to-optical SED also resemble an LRD. The broad line yields the first virial BH-mass estimate at z≈10, with a fiducial 3.6×10⁷ M⊙ BH accreting at λEdd≈0.11, or 2.1×10⁶ M⊙ in an Eddington-limited LRD-calibrated alternative. At a cosmic age of only 470 Myr, either interpretation makes MoM-BL-z10 a stringent benchmark for rapid early BH assembly, requiring either sustained super-Eddington growth from a light seed or a substantially heavier seed.
Sources and evidence (26)
- 2610.28735v1: Discovery of a Broad-Line Active Galactic Nucleus at $z = 9.98$
The James Webb Space Telescope (JWST) has uncovered a previously unexplored population of faint active galactic nuclei (AGNs) in the early Universe. We present MoM-BL-z10 at $z=9.9837\pm0.0009$, identified through a systematic search for broad-line AGNs at $z\geq6$ using public JWST/NIRSpec PRISM spectra from the DAWN JWST Archive. The PRISM spectrum exhibits a broad component in H$β$ at 5.35 microns. A narrow+broad Gaussian fit yields a broad H$β$ detection at S/N = 3.87, with FWHM = $3480^{+2040}_{-950}$ km s$^{-1}$ and $L_{{\rm H}β,{\rm broad}}=1.25^{+0.33}_{-0.31}\times10^{42}$ erg s$^{-1}$. The detection of [Ne III] $\lambda3870$ and the high [Ne III]/[O II] and [O III]/H$β$ ratios further support the AGN interpretation. Its rest-frame UV and optical continuum slopes, compact NIRCam morphology, and a tentative MIRI F770W detection suggest similarities to Little Red Dots (LRDs). The broad H$β$ detection enables the first virial SMBH mass estimate at $z\sim10$. We derive $M_{\rm BH}=3.6^{+5.8}_{-1.7}\times10^7 M_\odot$ and $λ_{\rm Edd}=0.11^{+0.10}_{-0.07}$ using the standard single-epoch virial calibration and quasar bolometric correction. We also consider an alternative scenario adopting the LRD-specific bolometric correction and assuming $λ_{\rm Edd}=1$, which yields $M_{\rm BH}=2.1^{+0.6}_{-0.5}\times10^6 M_\odot$. Under either scenario, the inferred SMBH mass at a cosmic age of only 470 Myr highlights the challenge of rapid BH growth in the early Universe, suggesting super-Eddington accretion from a stellar-mass seed or a more massive seed. As the highest-redshift broad-line AGN identified to date, MoM-BL-z10 provides a new observational benchmark for understanding the early growth of supermassive black holes.
- 2610.28735v1: Discovery of a Broad-Line Active Galactic Nucleus at $z = 9.98$
We report the discovery of MoM-BL-z10, the highest-redshift broad-line AGN currently known at z = 9.98 z=9.98 , identified through our systematic search for broad-line AGNs at 6 < z < 10 6<z<10 using archival JWST/NIRSpec PRISM spectra. A full description of the survey will be presented in X. Cai et al. (in preparation). Our main conclusions are as follows:
- 2610.28735v1: Discovery of a Broad-Line Active Galactic Nucleus at $z = 9.98$
MoM-BL-z10 at z = 9.98 z=9.98 is the highest-redshift object in our broad-line AGN sample, selected solely on the basis of NIRSpec/PRISM spectroscopy of 1,247 objects at 6.0 ≤ z ≤ 10.3 6.0\leq z\leq 10.3 without photometric pre-selection. The H β \beta emission-line profile of MoM-BL-z10 is well reproduced by a model consisting of narrow and broad Gaussian components, with the narrow component constrained by the [O iii ] λ 4960 \lambda 4960 line profile. The BIC favors this model over a narrow-line-only model with Δ BIC = − 15.55 \Delta{\rm BIC}=-15.55 . The broad H β \beta component is detected at S/N = 3.87 =3.87 , with FWHM = 3480 − 950 + 2040 \mathrm{FWHM}=3480^{+2040}_{-950} km s -1 .
- 2610.28735v1: Discovery of a Broad-Line Active Galactic Nucleus at $z = 9.98$
The AGN interpretation of MoM-BL-z10 is further supported by its compact morphology in F444W, and the detection of strong [O iii ] λ 4960 \lambda 4960 and [Ne iii ] λ 3869 \lambda 3869 emission. The high-excitation emission-line ratios place MoM-BL-z10 in the AGN-like regions of both the [O ii ]-FLR and OHNO diagnostic diagrams, well separated from the loci of star-forming galaxies.
- 2610.28735v1: Discovery of a Broad-Line Active Galactic Nucleus at $z = 9.98$
The rest-frame UV and optical slopes of MoM-BL-z10 are consistent with a z = 10 z=10 LRD, albeit with a large uncertainty in β opt \beta_{\rm opt} ( = 0.94 ± 0.83 =0.94\pm 0.83 ). We also find a tentative detection (S/N = 3.3 =3.3 ) in MIRI F770W, which, if real, lends further support to its LRD-like nature.
- 2610.28735v1: Discovery of a Broad-Line Active Galactic Nucleus at $z = 9.98$
We estimate the AGN bolometric luminosity of MoM-BL-z10 as L bol = 4.95 − 1.09 + 1.39 × 10 44 erg s − 1 L_{\rm bol}=4.95^{+1.39}_{-1.09}\times 10^{44}~{\rm erg~s^{-1}} , adopting the standard quasar bolometric correction. Using the rest-frame 5100 Å continuum luminosity and broad H β \beta line width, we derive a virial BH mass of M BH = 3.59 − 1.71 + 5.79 × 10 7 M ⊙ M_{\rm BH}=3.59^{+5.79}_{-1.71}\times 10^{7}~M_{\odot} and an Eddington ratio of λ Edd = 0.11 − 0.07 + 0.10 \lambda_{\rm Edd}=0.11^{+0.10}_{-0.07} . Alternatively, adopting the LRD-specific bolometric correction and assuming Eddington-limited accretion ( λ Edd = 1 \lambda_{\rm Edd}=1 ) yields an illustrative BH mass estimate of M BH , LRD = 2.1 × 10 6 M ⊙ M_{\rm BH,LRD}=2.1\times 10^{6}~M_{\odot} .
- 2610.28735v1: Discovery of a Broad-Line Active Galactic Nucleus at $z = 9.98$
The broad H β \beta emission in MoM-BL-z10 lies near the long-wavelength limit of the extended NIRSpec/PRISM coverage, while broad H α \alpha would be challenging to detect with MIRI due to its lower sensitivity. Thus, the redshift of MoM-BL-z10 may be close to the practical redshift limit for identifying faint AGNs through broad Balmer emission with JWST. Extending systematic spectroscopic searches to larger samples with well-characterized selection functions will help establish how common these early AGNs are and provide further constraints on BH formation and growth.
- 2610.28735v1: Discovery of a Broad-Line Active Galactic Nucleus at $z = 9.98$
Observed at z = 9.98 z=9.98 , when the Universe was only 470 470 Myr old, MoM-BL-z10 represents the highest-redshift broad-line AGN with an H β \beta -based virial BH mass estimate, bringing into sharper focus the long-standing challenge of understanding rapid SMBH growth in the early Universe.
- 2610.28735v1: Discovery of a Broad-Line Active Galactic Nucleus at $z = 9.98$
Figure 3 : The [O ii ]-FLR (left) and OHNO (right) diagnostics. The yellow star shows MoM-BL-z10, where we infer the [O iii ] λ 5008 \lambda 5008 from the [O iii ] λ 4960 \lambda 4960 flux by assuming a fiducial flux ratio of 2.98, and only the narrow H β \beta component is used. The error bars reflect the propagated 1 σ 1\sigma measurement uncertainties of the emission-line fluxes. An additional 0.20-dex uncertainty is added in quadrature to log ( [ Ne III ] / [ O II ] ) \log([\mathrm{Ne~III}]/[\mathrm{O~II}]) to account for possible blending with H η \eta , H ζ \zeta , and He I λ 3889 \lambda 3889 [ 90 , e.g.,] . Blue points show the SDSS AGN sample selected from BPT and [Ne v ] λ 3426 \lambda 3426 emission in the Portsmouth SDSS galaxy-property catalogue [ 22 ] ; orange contours indicate 50, 70, and 90% of the density of low-redshift BPT-selected MPA–JHU SF galaxies from the MPA–JHU catalogue of SDSS DR8 galaxy spectra [ 12 , 42 ] . Other symbols represent high-redshift ( z > 5 z>5 ) JWST AGNs published in the literature [ 91 , 89 , 92 , 64 , 90 , 7 ] . The arrow in the left panel indicates the effect of dust attenuation corresponding to E ( B − V ) = 0.2 E(B-V)=0.2 mag, assuming the attenuation law of Calzetti et al. [13] .
- 2610.28735v1: Discovery of a Broad-Line Active Galactic Nucleus at $z = 9.98$
Figure 5 : Illustrative black hole growth tracks of MoM-BL-z10 as a function of redshift assuming continuous accretion at fixed Eddington ratios with 10% radiative efficiency. The yellow star shows the fiducial virial SMBH mass of MoM-BL-z10, while the white star shows the LRD-based SMBH mass estimate assuming Eddington-limited accretion. The yellow stripe shows the backward extrapolation of the fiducial BH mass, assuming the observed Eddington ratio of λ Edd = 0.1 \lambda_{\mathrm{Edd}}=0.1 . The orange and blue stripes show the expected growth curves from a heavy ( 10 4 − 5 M ⊙ 10^{4-5}~M_{\odot} ) and a light (10–100 M ⊙ M_{\odot} ) seed BH, respectively, assuming continuous Eddington-limited accretion ( λ Edd = 1 \lambda_{\rm Edd}=1 ) beginning at z = 25 z=25 . The widths of these stripes correspond to their seed mass ranges. The lighter, hatched blue stripe shows the same light-seed track for a super-Eddington accretion case ( λ Edd = 2 \lambda_{\rm Edd}=2 ). Other symbols show known high-redshift quasars and AGNs in the literature; z ∼ 7.5 z\sim 7.5 luminous quasars [ 96 , 9 , 101 , diamonds;] , Euclid quasars [ 100 , pentagons;] , and JWST AGNs shown in Figure 4 with the same symbols. UHZ1 is shifted by Δ z = + 0.6 \Delta z=+0.6 from its spectroscopic redshift for clarity. For the Euclid quasars, black hole masses are estimated from their bolometric luminosities assuming λ Edd = 0.25 \lambda_{\rm Edd}=0.25 , the median value of the comparably luminous z ∼ 6 z\sim 6 quasars [ 72 ] .
- 2609.07025v1: Between Little Red Dots and Star-Forming Galaxies: A Sequence in the Optical Continuum Slope
Our analysis yields three main results: (i) neither dust reddening nor quiescent stellar populations can account for the vertical sequence in the β UV \beta_{\mathrm{UV}} – β opt \beta_{\mathrm{opt}} plane; (ii) both β opt \beta_{\mathrm{opt}} and the morphological extent vary smoothly between the star-forming galaxy and the LRD area, with no clear evidence of bimodality; and (iii) the LRD end of the sequence can possibly be described by a linear mixing of a star-forming host and a BH* component with η \eta ranging from 0.006 0.006 – 0.1 0.1 , consistent with previous M BH M_{\mathrm{BH}} – M ∗ M_{*} estimates for LRDs (Figure 14 ).
- 2609.07025v1: Between Little Red Dots and Star-Forming Galaxies: A Sequence in the Optical Continuum Slope
These results motivate a simple unified picture: a galaxy’s position along the sequence is set by the relative contribution of the BH* component to the total continuum. The BH*-dominant phase is observed as an LRD, the host-dominant phase as an ordinary star-forming galaxy, and the intermediate population of Bins 2 and 3 as the transition between the two. Crucially, this interpretation depends only on the variation of the BH* contribution along the sequence, not on the absolute value of η \eta .
- 2512.02096v1: Discovery of two little red dots transitioning into quasars
Figure 2 : JWST NIRCam F444W slitless spectra of the Forges . We also show the best-fit results and associated residuals. Prominent emission features (e.g., He i , O i λ 11287 \lambda 11287 , Pa γ \gamma , Pa δ \delta ) are labeled. Short vertical lines at the top, labeled with line names, mark the theoretical positions of the emission lines. For Forge II , A zoom-in on the Pa δ \delta absorption feature is shown in the subpanel, and additional spectroscopic coverage from DESI (covering the wavelength ranges of Ly α \alpha , N v , O i λ 1304 \lambda 1304 , C iv , He ii , and C iii] ) and HST G141 (Mg ii ) is also displayed. The gray-shaded regions indicate the wavelength ranges masked during the fitting process due to contamination from neighboring sources in the NIRCam spectra.
- 2512.02096v1: Discovery of two little red dots transitioning into quasars
We estimate the central BH masses M BH M_{\mathrm{BH}} and bolometric luminosities L bol L_{\rm bol} of the Forges using the spectral and photometric data above. We first model their continuum and line emission and absorption features in the JWST slitless spectra (Methods), and the best-fit results are listed in Extended Data Table 1 . The full widths at half maximum (FWHM) of the emission lines are about several thousand km s -1 , confirming their AGN nature. In addition, the strong O i λ 11287 \lambda 11287 emission agrees with the predicted signature of high-accretion SMBHs 29 . Assuming that these lines originate from the AGN broad-line regions, we calculate BH mass using the broad Paschen emission lines and the 1 μ \mu m continuum luminosity 30 . The resultant masses are ( 3.72 ± 1.86 ) × 10 8 M ⊙ (3.72\pm 1.86)\times 10^{8}\,M_{\odot} and ( 9.78 ± 4.89 ) × 10 8 M ⊙ (9.78\pm 4.89)\times 10^{8}\,M_{\odot} ( M ⊙ M_{\odot} is the Solar mass), respectively. Forge II was also observed by the DESI spectroscopic survey and HST G141 slitless spectroscopy. Only narrow Ly α \alpha emission line (FWHM = 556 km s − 1 =556\rm\penalty\ km\penalty\ \,s^{-1} ) is detected by DESI, shown in the lower panel of Figure 2 . Canonical AGN broad lines, including Ly α \alpha , N v λ 1240 \lambda 1240 , C iv λ 1549 \lambda 1549 , He ii λ 1640 \lambda 1640 , and C iii] λ 1909 \lambda 1909 , are not detected, which is consistent with previous results that high-redshift LRDs have weak or no broad UV emission lines 7 , 28 . We assume that the central AGNs are obscured in the rest-frame UV, but dominate in the near-IR, radio, and X-ray bands, then we obtain AGN bolometric luminosities L bol L_{\rm bol} by integrating their reprocessed SEDs (Extended Data Figure 3 ). The inferred Eddington ratios are L bol / L Edd = 0.17 − 0.08 + 0.25 L_{\rm bol}/L_{\rm Edd}=0.17^{+0.25}_{-0.08} and 0.24 − 0.12 + 0.42 0.24^{+0.42}_{-0.12} , where the Eddington luminosity is L Edd = 1.3 × 10 38 ( M BH / M ⊙ ) erg s − 1 L_{\rm{Edd}}=1.3\times 10^{38}\ (M_{\rm{BH}}/M_{\odot})\ \rm{erg\ s^{-1}} .
- 2505.04825v1: SHELLQs. Bridging the Gap: JWST Unveils Obscured Quasars in the Most Luminous Galaxies at z > 6
inally, we estimated the black hole mass (MBH) from the width and luminosity of the Hα BLR compo- nent, following the recipe of Greene & Ho (2005) and Reines et al. (2013). The resultant values (MBH = 107.8−9.1M⊙) overlap with the distributions of low- z SDSS quasars (e.g., Rakshit et al. 2020; Toba et al. 2021) and UV-luminous quasars at z ∼ 6 (e.g., Yang et al. 2021), but are at the lower end on av- erage. The Eddington ratios are in the range from λEdd = 0.5 to 1.1, suggesting that sub-Eddington to Ed- dington accretion takes place in the BL objects. Figure Figure 8. Black hole masses and bolometric lumi- nosities of luminous quasars (open squares; Willott et al. 2010; Shen et al. 2019; Yang et al. 2021, 2023) and SHEL- LQs low-luminosity quasars (grey dots; Onoue et al. 2019; Matsuoka et al. 2019b; Onoue et al. 2024, M. Onoue et al., in prep.) at z ∼ 6 −7. The dark blue sym- bols represent JWST BHEs at z > 4 (Harikane et al. 2023; ¨Ubler et al. 2023; Furtak et al. 2024; Greene et al. 2024; Juodˇzbalis et al. 2024, 2025; Maiolino et al. 2024b; Matthee et al. 2024; Schindler et al. 2024; Lin et al. 2025). The dotted lines represent constant Eddington ratios of λEdd = 1, 0.1, and 0.01, from top to bottom. 8 compares the estimated values with those of classical quasars and other JWST BHEs,4 demonstrating that the present objects bridge the two AGN populations. We also note the overall similarity of the present tar- gets with the SDSS type-II quasar candidates at lower redshifts (Alexandroffet al. 2013; Greene et al. 2014), both of which are characterized by black hole masses of MBH ∼108−9M⊙with sub-Eddington accretion, mild dust obscuration (AV ∼0 −3 mag), and high line lumi- nosities (L[OIII] ∼1043−45 erg s−1). However, we caution that our estimates reported above have large uncertainties. Black hole masses derived from single-epoch spectra are associated with statistical uncertainty of 0.3 – 0.5 dex (e.g., Vestergaard & Peterson 2006). The bolometric correc- tion to Hα luminosity has been derived from low-z AGNs, and we do not know how accurate it is when 4 This figure is a collection of heterogeneous measurements, since different works used different assumptions
- 2505.04825v1: SHELLQs. Bridging the Gap: JWST Unveils Obscured Quasars in the Most Luminous Galaxies at z > 6
nding the whole picture of SMBH activity during cosmic dawn. 4. SUMMARY We present the results from JWST/NIRSpec observa- tions of 13 objects in the EoR. The sample was originally selected by the HSC-SSP imaging survey over >1000 deg2, and all the objects have luminous Lyα emission
- 2507.23774v1: Lord of LRDs: Insights into a "Little Red Dot" with a low-ionization spectrum at z = 0.1
The above results suggest J1025+1402 is extremely X-ray weak compared to typical AGN in the local Universe. In Figure 14 , we compare the bolometric-to-X-ray luminosity ratio of J1025+1402 with those of optically selected local AGN as well as high- z z broad-line AGN and LRDs selected by JWST . In this plot, all X-ray limits included represent 90% confidence limits. While J1025+1402 lies at the low-luminosity end, it has L bol / L 2 − 10 keV > 131 L_{\rm bol}/L_{\rm 2-10~keV}>131 as the 3 σ 3\sigma limit and L bol / L 2 − 10 keV > 336 L_{\rm bol}/L_{\rm 2-10~keV}>336 as the 90% confidence limit (assuming a standard bolometric conversion from H α \alpha from Stern & Laor, 2012 ), which is significantly higher compared to the local AGN, and even the current limits for JWST -selected Type 1 AGN and LRDs. For comparison, we plot two bright LRDs, the Rosetta Stone and the Monster, which have more stringent limits on L bol / L 2 − 10 keV L_{\rm bol}/L_{\rm 2-10~keV} but have 1 − 2 1-2 magnitudes higher nominal bolometric luminosities.
- 2507.23774v1: Lord of LRDs: Insights into a "Little Red Dot" with a low-ionization spectrum at z = 0.1
The extreme apparent X-ray weakness of J1025+1402 might potentially indicate similarly extreme levels of obscuration in this system. To investigate this further, we estimate the absorption columns that would be needed to result in the X-ray non-detections reported above, under the assumption that J1025+1402 should intrinsically be similar to other AGN. To do so, we use the information provided in Table 4 along with the λ Edd \lambda_{\rm{Edd}} -dependent 2–10 keV bolometric corrections ( κ 2 − 10 \kappa_{2-10} ) presented for type-1 AGN in Lusso et al. (2012) to predict what the intrinsic 2–10 keV luminosity ( L pred , int L_{\rm{pred,int}} ) of J1025+1402 should be (and in the case of the 10-30 keV band, subsequently determine the predicted intrinsic 10–30 keV luminosity assuming a Γ = 1.7 \Gamma=1.7 powerlaw continuum). We then determine what the observed luminosity ( L pred , obs L_{\rm{pred,obs}} ) should be for a range of different line-of-sight column densities at the redshift of J1025+1402, accounting for losses due to both photoelectric absorption and scattering using models for both included in xspec ( Arnaud 1996 ). These predicted luminosities are then compared to the corresponding limit on the luminosity provided by the X-ray data (which are also re-computed for each value of N H N_{\rm{H}} considered; we again consider 90% confidence limits here, as in Figure 14 ).
- 2512.03281v1: A Comprehensive JWST/NIRSpec Census of Broad-Line Active Galactic Nuclei: Faint, Tiny, but Highly Accreting Sources in the Remote Universe
Based on these selection criteria, we identify 252 BLAGNs. These objects are listed in Table 1 and their Gaussian fitting results are shown in the Appendix (Figure 7 ). Among the identified BLAGNs, ∼ \sim 100 sources have been previously reported in the literature. Within our sample, 15 AGNs are identified from the G395H grating, 14 from G235H, 88 from G235M, 121 from the G395M grating, and 14 from the G140M grating. All identified BLAGNs exhibit prominent broad-line emission in the H α \alpha line or, where available, the H β \beta line. There are 5 sources that do not pass our criteria though previous studies identified them as BLAGNs. Our measurements yield their FWHM broad \text{FWHM}_{\text{broad}} ∼ \sim 800 – 900 km s -1 , which is just below our 1000 km s -1 criteria. To be consistent with the literature, we still keep them in the Table 1 .
- 2512.03281v1: A Comprehensive JWST/NIRSpec Census of Broad-Line Active Galactic Nuclei: Faint, Tiny, but Highly Accreting Sources in the Remote Universe
In addition, recent findings from JWST have revealed that compared to local AGNs, high- z z AGNs exhibit higher bolometric luminosities and Eddington ratios as a function of black hole mass, suggesting higher accretion efficiencies and rapid black hole growth [ 26 , 68 , 39 , 65 , e.g.,] . These results suggest that faint AGNs may represent an early evolutionary phase in black hole growth, and that SMBHs in the early universe grow faster than their host galaxies, enriching the universe with higher metallicity [ 68 , e.g.,] . However, the majority of these conclusions are based on single or small sample high-redshift AGNs [ 65 , e.g.,] . Therefore, their conclusions could be influenced by selection bias, as AGNs with higher accretion rates are intrinsically brighter and more easily detected, potentially leading to an overgeneralization of the accretion rates to all high-redshift AGNs.
- 2505.04609v1: CAPERS-LRD-z9: A Gas Enshrouded Little Red Dot Hosting a Broad-line AGN at z=9.288
Using JWST /NIRSpec PRISM spectroscopy from the CAPERS program, we identify the highest redshift ( z = 9.288 z=9.288 ) BLAGN yet discovered—CAPERS-LRD-z9—based on a strong detection of broad (FWHM= 3525 ± 589 3525\pm 589 km s -1 ) H β \beta emission.
- 2505.04609v1: CAPERS-LRD-z9: A Gas Enshrouded Little Red Dot Hosting a Broad-line AGN at z=9.288
From our canonical black hole mass, we calculate a black hole mass to stellar mass ratio M BH / M ∗ > 4.5 % M_{\textrm{BH}}/M_{*}>4.5\% for CAPERS-LRD-z9. However, we recognize our estimates of both M BH M_{\textrm{BH}} and M ∗ M_{*} are subject to large systematic uncertainties. Based on our systematic bounds of M BH M_{\textrm{BH}} , the lower limit on M BH / M ∗ M_{\textrm{BH}}/M_{*} ranges from > > 46% to as low as > > 0.5%. Even our absolute lowest bound presents a significant deviation from the “typical” M BH / M ∗ ∼ 0.1 % M_{\textrm{BH}}/M_{*}\sim 0.1\% value exhibited by local quasars.
- 2601.14905v1: The eJWST active galactic nucleus observation catalogue
The target descriptions retrieved from the aforementioned keywords are dependent on the proposers’ input. As a result, we could not assume that targets were consistently labelled as AGNs, especially since sometimes targets lacked the description field. Also, some AGN sources can fall under different descriptors (e.g. starburst or high-redshift galaxy) and are not labelled as AGNs in the APT field. To address possibly missed AGNs, we implemented an additional search. We searched the approved STScI JWST listed programmes 5 5 5 https://www.stsci.edu/jwst/science-execution/approved-programs for additional AGNs, described either in the abstract or elsewhere in the proposal. Specifically, we checked the GO and the Guaranteed Time Observation programmes during all available cycles, as well as the ERS programmes, the DDT, and the calibration programmes. From the GO we checked all the proposals listed under ‘Galaxies’ and ‘Supermassive Black Holes and Active Galaxies’. Naturally, some of these proposals include targets already found in our previous search. We cross-checked the two searches and removed duplicated results. This search method increased our sample to 968 targeted AGNs.
- 2601.14905v1: The eJWST active galactic nucleus observation catalogue
Results. The resulting catalogue contains a total of 3,242 individual AGNs included in JWST observations. This is one of the first extensive collections of AGN observations from the JWST. It includes detailed information about the targets (name, coordinates, and redshift) and specifics of the JWST observations (instrument, aperture, filter, etc.), and provides links for data downloads.
- 2606.05281v1: Little red dots as a cosmological probe: constraining $H_0$ with quasi-periodic pulsations
In this work, we propose a novel cosmological framework linking the quasi-periodic variability of LRDs to distance measurements via a physically motivated P P – L L – T eff T_{\rm eff} relation for idealized radiation-pressure-supported envelopes. Applying this framework to the lensed LRD R2211-RX1, we obtain a preliminary constraint of H 0 = 120.7 − 46.5 + 47.0 km s − 1 Mpc − 1 H_{0}=120.7^{+47.0}_{-46.5}\ \mathrm{km\ s^{-1}\ Mpc^{-1}} . Although the uncertainty remains large, it is dominated by the limited constraint on the pulsation period and serves as a critical proof-of-concept. Our forecast indicates that 10 years of monitoring can reduce H 0 H_{0} statistical uncertainty to 3–20%, depending on the intrinsic period.
- 2606.05281v1: Little red dots as a cosmological probe: constraining $H_0$ with quasi-periodic pulsations
The ultimate accuracy of this framework depends on quantifying systematic uncertainties in the P P – L L – T eff T_{\rm eff} relation, which remain to be fully characterized. Empirical calibration via low-redshift LRDs and improved modeling are essential to mitigate these effects and validate the theoretical baseline. Once calibrated, this method will provide a robust, independent H 0 H_{0} probe. Though nascent, this approach offers a complementary test for cosmological models, particularly at high redshifts where standard candles are scarce.
Abstract
The James Webb Space Telescope (JWST) has uncovered a previously unexplored population of faint active galactic nuclei (AGNs) in the early Universe. We present MoM-BL-z10 at $z=9.9837\pm0.0009$, identified through a systematic search for broad-line AGNs at $z\geq6$ using public JWST/NIRSpec PRISM spectra from the DAWN JWST Archive. The PRISM spectrum exhibits a broad component in H$β$ at 5.35 microns. A narrow+broad Gaussian fit yields a broad H$β$ detection at S/N = 3.87, with FWHM = $3480^{+2040}_{-950}$ km s$^{-1}$ and $L_{{\rm H}β,{\rm broad}}=1.25^{+0.33}_{-0.31}\times10^{42}$ erg s$^{-1}$. The detection of [Ne III] $\lambda3870$ and the high [Ne III]/[O II] and [O III]/H$β$ ratios further support the AGN interpretation. Its rest-frame UV and optical continuum slopes, compact NIRCam morphology, and a tentative MIRI F770W detection suggest similarities to Little Red Dots (LRDs). The broad H$β$ detection enables the first virial SMBH mass estimate at $z\sim10$. We derive $M_{\rm BH}=3.6^{+5.8}_{-1.7}\times10^7 M_\odot$ and $λ_{\rm Edd}=0.11^{+0.10}_{-0.07}$ using the standard single-epoch virial calibration and quasar bolometric correction. We also consider an alternative scenario adopting the LRD-specific bolometric correction and assuming $λ_{\rm Edd}=1$, which yields $M_{\rm BH}=2.1^{+0.6}_{-0.5}\times10^6 M_\odot$. Under either scenario, the inferred SMBH mass at a cosmic age of only 470 Myr highlights the challenge of rapid BH growth in the early Universe, suggesting super-Eddington accretion from a stellar-mass seed or a more massive seed. As the highest-redshift broad-line AGN identified to date, MoM-BL-z10 provides a new observational benchmark for understanding the early growth of supermassive black holes.
Discussion
Discussion access requires a security token. Register for the weekly digest.