Weekly issue · Oct 19–25, 2026

Week 43, 2026

7 curated papers

A Little Red Dot emerging from a nitrogen-rich UV-luminous galaxy with Very Massive Stars

Alberto Torralba, Jorryt Matthee, Rui Marques-Chaves et al.

Medium-resolution JWST/NIRSpec spectroscopy of the single z=6.6 galaxy COLA1 links a very young, VMS-favored UV population, extreme nitrogen enrichment, and LRD-like optical Balmer structure; the proposed evolution into an LRD remains model-dependent.

What changes COLA1 combines VMS-favored UV fitting with an optical spectrum that is redder (βopt=−1.1), has broad Hα and Hβ, and includes narrow Balmer absorption. The narrow Balmer components are consistent with dust-free Case-B ratios, whereas the broad component has Hα/Hβ≈9. The authors argue this could arise either from nuclear dust or radiative transfer in a dense LRD-like wind. Evolving their best-fit stellar population by 5 Myr yields a model V-shaped LRD-like spectrum and a predicted 1–2 mag UV fading; this is an evolutionary scenario, not an observation of temporal change or proof of black-hole seeding.
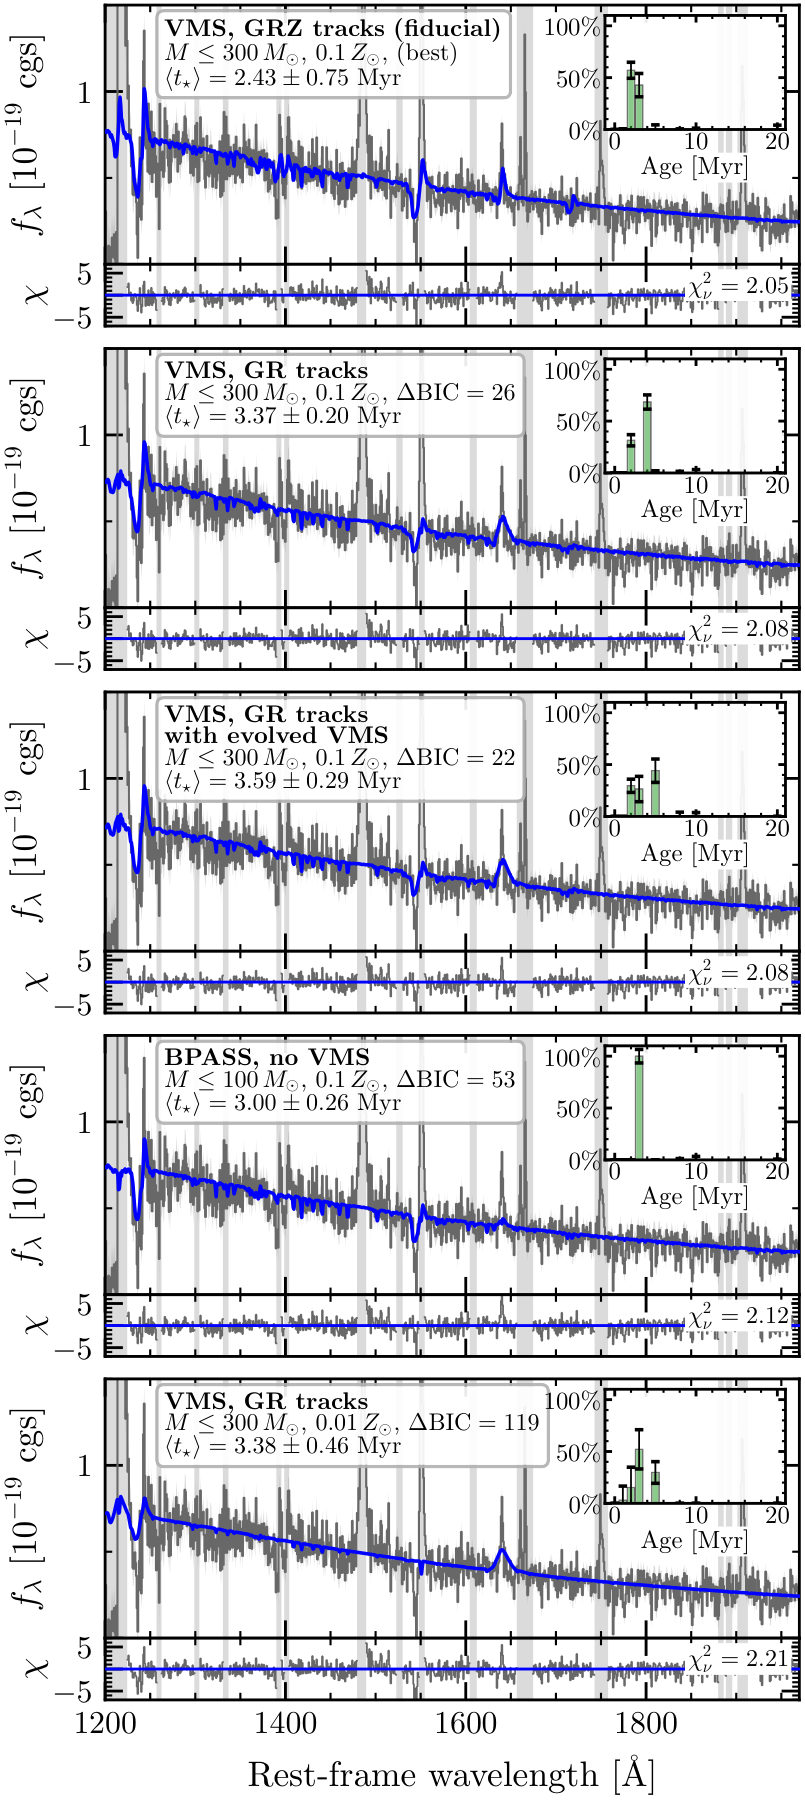
Figure 3 from A Little Red Dot emerging from a nitrogen-rich UV-luminous galaxy with Very Massive StarsFigure 3 · Open paper
Figure notes (3)
  • Figure 3. Tests whether UV stellar-population fits require VMS: the caption reports lower BIC for VMS/GRZ models than for non-VMS BPASS models and very young fitted ages.
  • Figure 7. Tests whether a homologous-wind radiative-transfer model can reproduce broad Hα wings, P-Cygni-like absorption, and the elevated broad Balmer decrement without invoking strong dust attenuation.
  • Figure 11. Tests the proposed evolutionary bridge to LRDs by subtracting the UV VMS model and by aging the fitted population; both comparisons are model constructions rather than time-resolved evidence.
Discovery of a Broad-Line Active Galactic Nucleus at $z = 9.98$

Xingyao Cai, Akio K. Inoue, Masafusa Onoue et al.

A systematic JWST/NIRSpec search identifies MoM-BL-z10 at z=9.9837 as a candidate broad-line AGN. Its marginal-but-model-preferred broad Hβ enables a virial black-hole estimate, while alternative LRD assumptions shift the inferred mass substantially.

What changes The paper’s principal advance is an Hβ-based virial mass estimate for a broad-line AGN at z≈10, observed when the Universe was 470 Myr old. The authors also test an explicitly conditional LRD scenario: adopting an LRD-specific bolometric correction and imposing λEdd=1 gives MBH≈2.1×10^6 M⊙, not an independent mass measurement. The reported UV/optical slopes and tentative F770W detection (S/N=3.3) make the source LRD-like, but do not demonstrate that it belongs to a distinct LRD population.

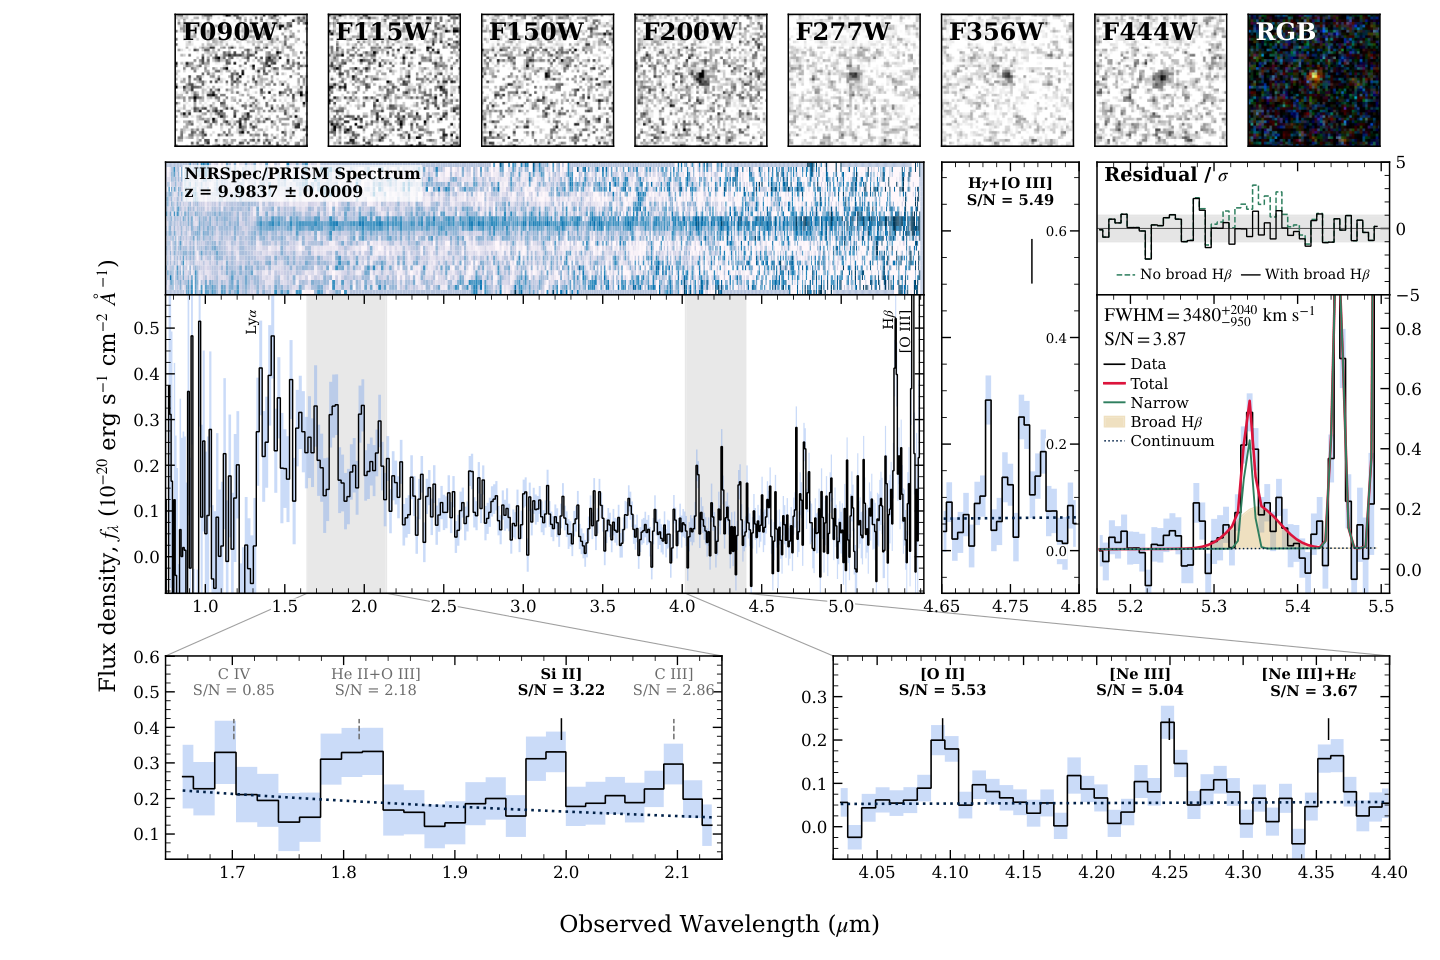
Figure 1 from Discovery of a Broad-Line Active Galactic Nucleus at $z = 9.98$Figure 1 · Open paper
Figure notes (3)
  • Figure 1. Tests whether the spectral feature is better represented by narrow plus broad Hβ than narrow emission alone, while showing the imaging compactness and the quoted 1σ spectral uncertainty band.
  • Figure 3. Tests the excitation-based AGN interpretation against SDSS AGN and star-forming loci. It propagates line-flux errors and adds 0.20 dex to [Ne III]/[O II] for possible blends.
  • Figure 5. Tests illustrative growth requirements by comparing the two conditional mass estimates with continuous fixed-Eddington-ratio tracks for light and heavy seeds; it is a model exercise, not a reconstruction of the accretion history.

Clustering of JWST LRDs. Implications for PBHs and other early-forming seeds

Gert Hütsi

Using reported LRD abundances and clustering at z=4–8, the authors find that threshold-selected halos can reproduce both observables, whereas randomly activated, dynamically negligible PBHs predict near-unity bias and insufficient clustering.

What changes Rather than assessing a seed model from abundance alone, the paper jointly uses abundance and clustering to separate activation prescriptions. Its central conditional result is that clustering disfavors dynamically subdominant early seeds when LRD activity is random, but not PBHs whose accretion is restricted to massive halos. In the latter case, the authors estimate only ≈10⁻³–10⁻² of PBHs lie in relevant hosts, raising the required PBH fraction to ≈10⁻¹¹–10⁻⁷ while leaving it dynamically negligible; host halos then set the observable clustering.

Figure notes (3)
  • Figure 1. Tests whether a threshold-halo population can simultaneously occupy the observational number-density and bias bands. Constant-threshold and constant-redshift loci expose the mass–redshift degeneracy of this comparison.
  • Figure 3. Tests the PBH abundance required to equal the LRD density as a function of PBH mass, including the dependence on duty cycle. It addresses abundance feasibility, not the separate clustering prediction.
  • Figure 4. Tests why an abundance-matched PBH population does not yield LRD-like clustering: the PBH auto-spectrum is Poisson-noise dominated and the shot-noise-subtracted PBH bias remains near unity.

The Balmer Absorber Strength Problem of Little Red Dots

Hanpu Liu, Eliot Quataert, Bingjie Wang et al.

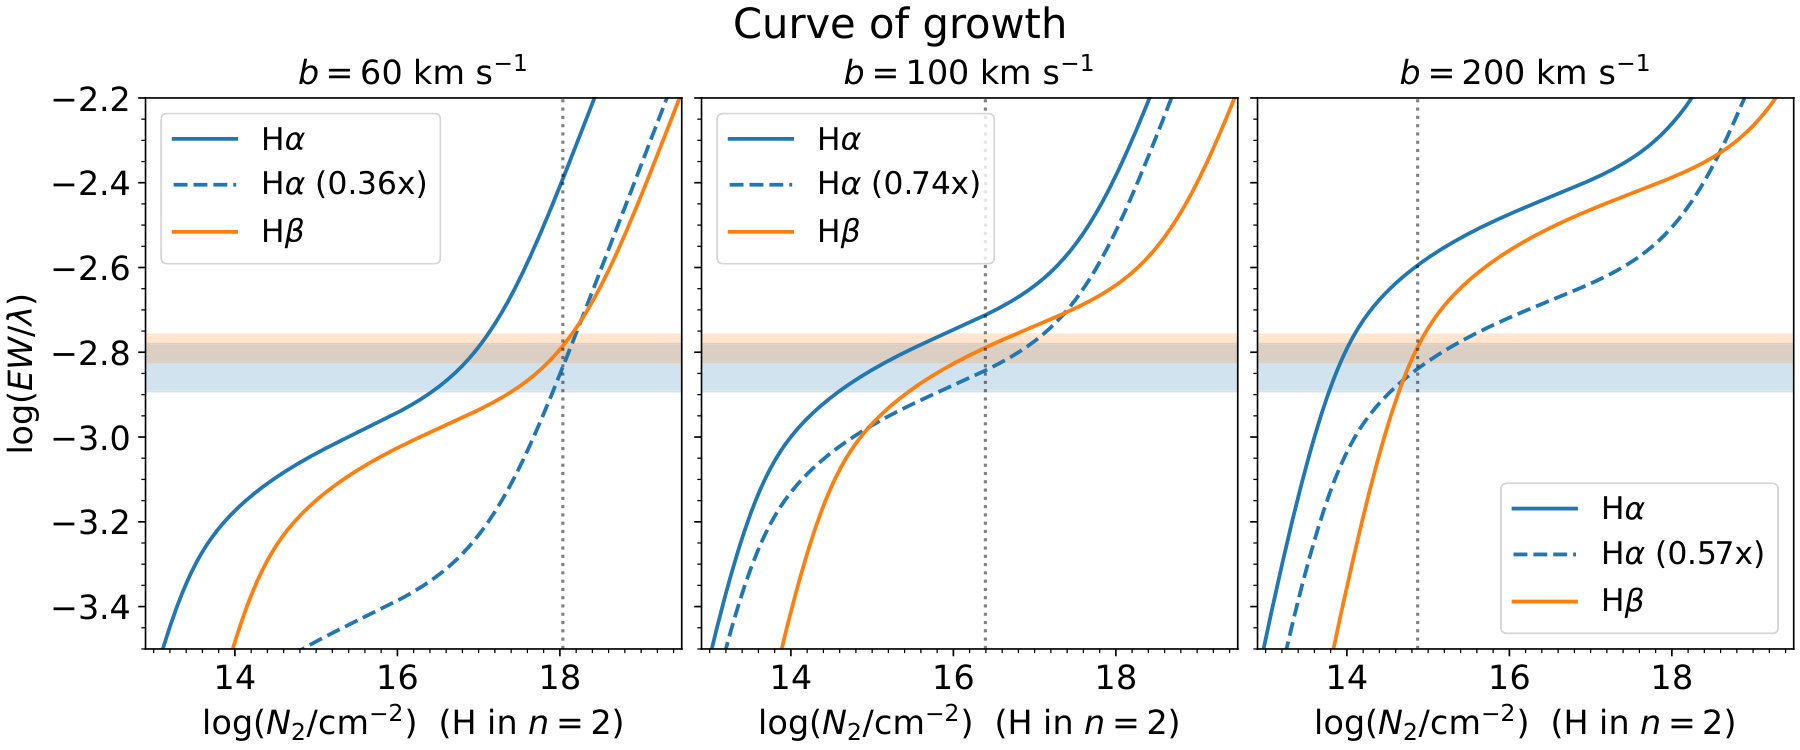
Photoionization calculations suggest that line emission from an optically thick Balmer absorber can preferentially fill Hα, explaining inverted Hα/Hβ absorption equivalent-width ratios in some LRDs. The result is a proof-of-concept whose inferred absorber properties remain radius- and structure-dependent.

What changes Rather than changing oscillator strengths or invoking only broadening, the paper explicitly adds the absorber’s source function to attenuation. Its proposed mechanism is differential radiative trapping: optically thick Balmer-α preferentially populates n=3, making the Hα source function stronger than Hβ while Paschen-α is not yet very optically thick. The calculation also tests Cloudy’s shielding treatment, reporting that the default implementation overpredicts N2p at high optical depth; a paired-shielding modification reproduces the cited analytic test within 10%. Thus, the model identifies line self-emission—and its radius dependence—as a potential environmental diagnostic.

Figure 1 from The Balmer Absorber Strength Problem of Little Red DotsFigure 1 · Open paper
Figure notes (3)
  • Figure 1. Tests the baseline discrepancy: standard curves of growth retain (EW/λ)Hα > (EW/λ)Hβ, whereas the plotted RUBIES-49140 1σ EW ranges show the reverse ordering.
  • Figure 2. Tests whether Cloudy models can produce differential line source functions as N2 changes; the source-function ratio reaches a low valley at intermediate N2, enabling relatively weak Hα absorption.
  • Figure 4. Tests the observational consequence of adding source functions to the curve of growth. The Hα and Hβ curves can cross near log(N2/cm−2) ≈ 15–17, with the outcome depending on absorber radius.

Poisson Clustering and Seed Effect of PBHs: Implications for Microlensing, Gravitational Waves, Little Red Dots and Ultra-Faint Dwarf Galaxies

Bernard Carr, Sebastien Clesse, Juan Garcia-Bellido et al.

This theoretical study argues that Poisson- and seed-driven primordial-black-hole clustering could affect microlensing, merger rates, ultra-faint dwarfs and little red dots, but its PBH-dark-matter interpretation remains sensitive to cluster evolution, Galactic-halo assumptions and non-Gaussian initial clustering.

What changes The distinctive synthesis is to connect one Poisson-cluster evolution framework to several tests: LMC microlensing geometry and efficiencies, Galactic dynamical survival, compact-binary merger-rate limits, and possible UFDG/LRD seeding. It also treats multimodal PBH mass functions, noting that a solar-mass density peak can coexist with a much larger mass-weighted mean relevant to clustering. The paper cautions that exponentially non-Gaussian primordial tails would yield stronger-than-Poisson clustering, for which cluster initial conditions require numerical simulations; this is an extension rather than a calibrated prediction for LRDs.

Figure notes (3)
  • Figure 1. Tests the calculated Poisson contribution to the linear density contrast against standard ΛCDM across redshift, and maps scale to implied halo mass and collapsed fraction for the stated f_PBH⟨mf⟩=10^3 M_sun example.
  • Figure 3. Tests how the model cluster mass–radius trajectory changes with the expansion parameter β=10 or 1000, while placing UFDG size and mass estimates on the same plane; it is a comparison of model tracks with estimates, not a fitted relation.
  • Figure 10. Tests which cluster mass–radius regions predict compact-binary merger rates above, within, or below LVK binary-neutron-star-rate intervals under stated PBH fractions and a 2-M_sun mass peak; interpretation is explicitly conditional on PBHs explaining those events.

NGC 3227 Blinks: An Extreme Changing-Look Event in a Seyfert Galaxy

Kaiwen Zhang, Michael S. Brotherton, Pu Du et al.

High-cadence monitoring of one Seyfert changing-look episode finds that NGC 3227’s continuum and broad Hβ dimmed sharply yet retained a 6–8-day reverberation lag, supporting an inner, high-column obscurer rather than ordinary stochastic accretion variability.

What changes The central addition is the combination of an extreme optical changing-look transition with phase-resolved reverberation mapping. The persistent lag is used geometrically: an obscurer external to the BLR would directly attenuate broad-line emission and would need to cover much of that extended region to reduce Hβ by ∼80%; a transiting screen would also predict differently timed or smeared continuum and line changes. The authors instead favor an interior screen that reduces ionizing radiation before it reaches the BLR. This is an inference from the measured timing and modeled attenuation, not a direct image or identification of the obscuring structure.

Figure 2 from NGC 3227 Blinks: An Extreme Changing-Look Event in a Seyfert GalaxyFigure 2 · Open paper
Figure notes (3)
  • Figure 2. Tests whether the broad-line change is real rather than a flux-calibration artifact: continuum-subtracted, host-subtracted epochal profiles show Hβ varying by over a factor of two while narrow [O III] remains essentially constant as an internal reference.
  • Figure 4. Tests the dim-phase reverberation signal. MICA reconstructs the 5100 Å and broad-Hβ light curves and supplies a lag posterior; ICCF supplies an independent centroid distribution. Their captioned medians are ∼7.7 and ∼6 days, respectively.
  • Figure 6. Summarizes, rather than independently tests, the proposed geometry: a dense Compton-thick structure interior to the BLR attenuates both the observed optical continuum and the ionizing continuum incident on the BLR.

Dual and lensed AGN at sub-arcsecond separations uncovered by ERIS

M. V. Zanchettin, F. Mannucci, Q. D'Amato et al.

AO-assisted ERIS/SPIFFIER spectroscopy of 34 Gaia Multi-Peak candidates resolves six sub-arcsecond dual AGN and seven lensed quasars, but foreground-star superpositions dominate the non-multiple outcomes and broad-line velocity offsets do not securely measure systemic pair velocities.

What changes This ERIS program adds six confirmed duals and seven lenses, of which only one lens was previously known, within its 34-object follow-up. It also reports the compact quad J1453+0529 with Einstein radius 0.21±0.02 arcsec and identifies J0602−3852 at z=3.04 as its most distant system. Rather than establishing a population rate for all AGN, these yields characterize a GMP-selected, luminous and predominantly unobscured type-1-QSO-oriented sample.

Figure 3 from Dual and lensed AGN at sub-arcsecond separations uncovered by ERISFigure 3 · Open paper
Figure notes (3)
  • Figure 3. Tests component-level spectral classification: spectra are extracted with combined 2D-Moffat functions to limit cross-contamination, and expected emission-line positions are marked for the two components.
  • Figure 5. Tests how dual and lensed GMP classifications vary with redshift, separation, and total Gaia G-band luminosity in the combined follow-up sample; quad-lens scales use enclosing-circle radii or specified Einstein radii.
  • Figure 8. Tests spatial deblending with an example dual AGN: it compares the broadband data, a two-component 2D-Moffat model, and the residual map.