2610.34552v1 · First listed 2026-10-27
Multiphase Gas Structure in JWST Little Red Dots
Radiative-transfer fits to 11 JWST little red dots find that a clumpy neutral component can jointly accommodate Hα, Hβ, and Balmer-break constraints where a smooth geometry often cannot, supporting—but not uniquely establishing—multiphase circumnuclear gas. [1][3]
Evidence
The authors fit Hα and Hβ profiles in 11 LRDs with JWST sensitive high-resolution spectroscopy and constrain the n=2 neutral-hydrogen column, N_HI,n=2, from the Balmer-break continuum. Their line pipeline removes a fitted continuum and a narrow host component traced by [O III], then compares instrumental-resolution-convolved radiative-transfer models over fixed velocity windows. MCMC samples posteriors using a PCA emulator of a precomputed simulation grid; quoted marginalized intervals are 68% credible intervals. Fits proceed from Hα alone to Hβ and the SED with the Hα-derived column posterior as a prior. For the two illustrated objects, smooth-model Hα columns are too low to reproduce both Hβ absorption and the break, whereas clumpy-model columns are consistent across probes. The abstract reports that the smooth-model Hα column is typically two orders of magnitude below the Balmer-break lower bound in affected objects. [1][3][8][9][10]
Earlier work
Earlier dense, ionized-cocoon modelling inferred electron-scattering optical depths around unity and argued for a nearly spherical gas distribution. This paper makes a more specific comparison: it tests that homogeneous-like geometry against a porous clumpy alternative using Balmer-line transfer and continuum constraints. Thus it challenges smoothness, rather than directly refuting an enshrouded-accretor interpretation. The supplied excerpt does not provide a like-for-like comparison of total hydrogen columns between the studies. [12][1]
What changes
The proposed explanation for deeper Hβ than Hα is geometry-dependent line transfer: in optically thick clumps, higher-opacity Hα predominantly surface-scatters and escapes, while Hβ penetrates farther and can be converted to other transitions through branching at the 4p level. The authors report that this permits one N_HI,n=2 to fit both lines, and argue that multiphase gas is required irrespective of the central engine. The latter is an author interpretation based on the tested model classes. [7][1]
Limits and open questions
The inference is conditional on the adopted smooth and clumpy geometries, host subtraction using [O III], priors on host line ratios and Balmer decrement, and emulator-based radiative-transfer grid. Because the Hβ and SED stages use an Hα-derived column prior, their reported agreement is not wholly prior-free, although unprioritized comparisons are also described in the figure caption. Two of 11 sources fail the Balmer-break detection criterion, so their Stage-3 SED column constraints are not meaningful. The supplied evidence does not establish that clumping is uniquely determined over other untested gas configurations or central-engine models. [3][8][9][4]
Based on the supplied abstract and selected HTML excerpts, plus one directly sourced main-figure caption. The extraction does not include the full numerical fit tables, complete main-text results, or a systematic comparison to alternative geometries.
Key figures
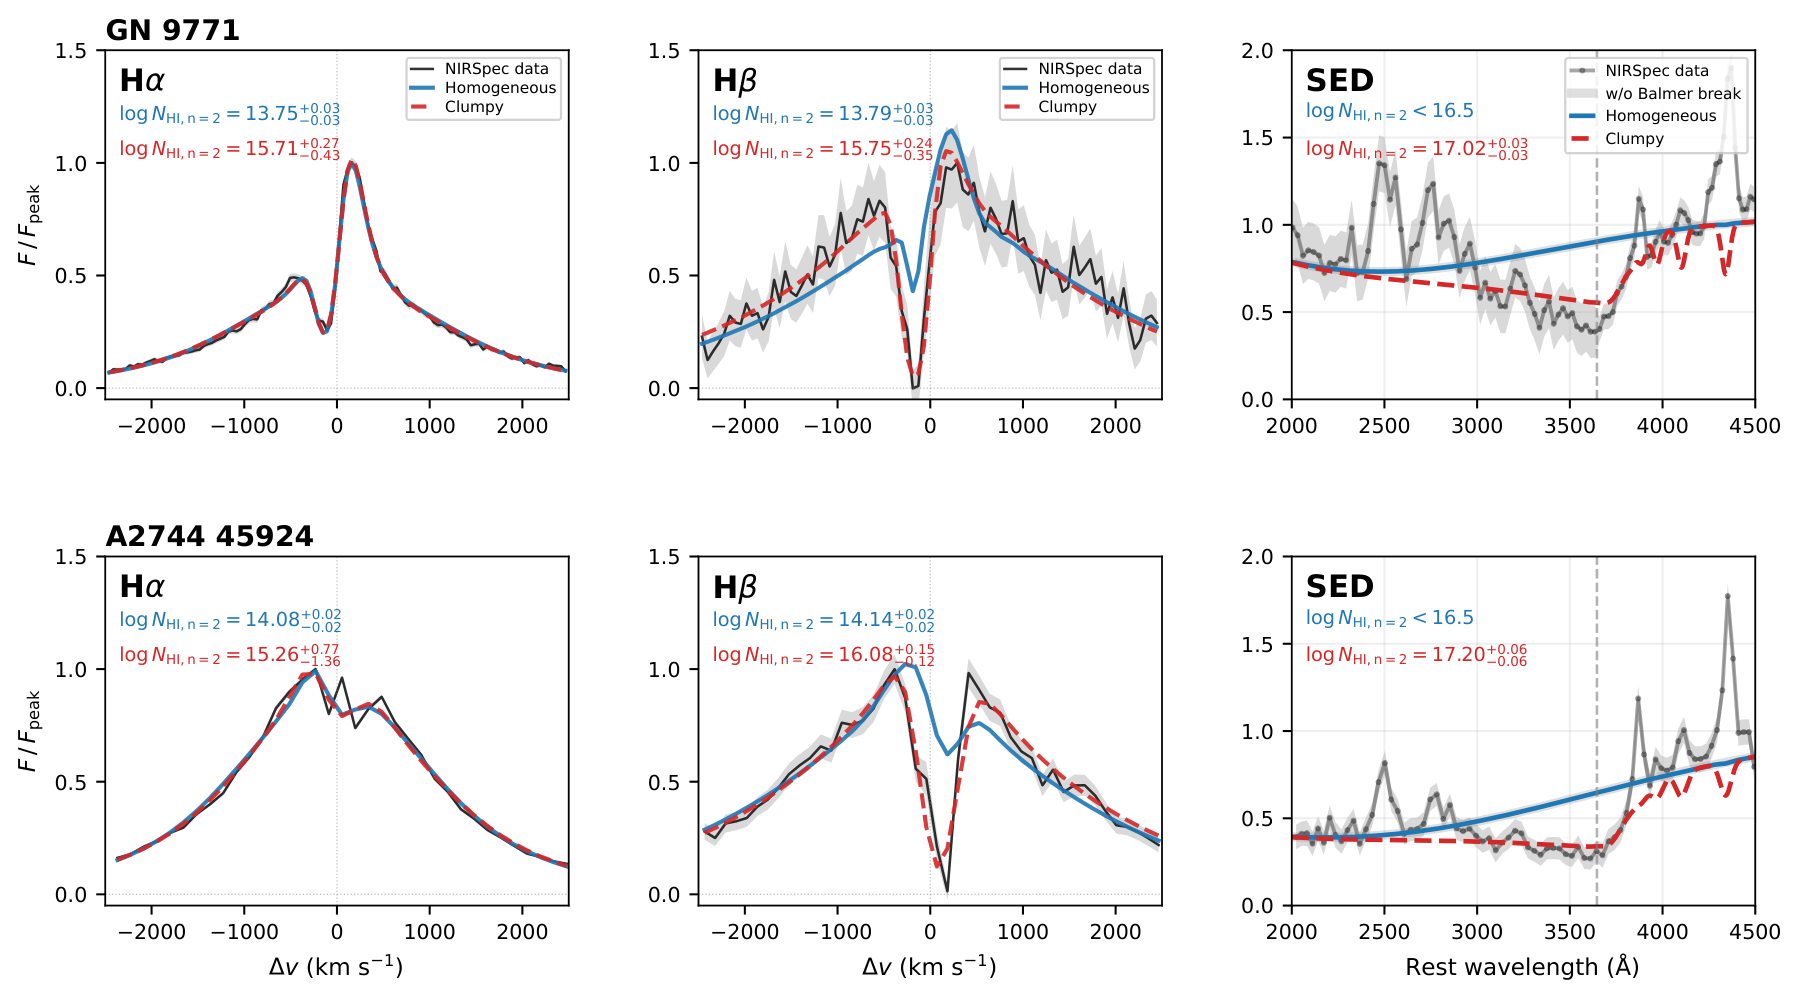
Tests whether one fitted n=2 neutral-hydrogen column can simultaneously account for Hα, Hβ, and the Balmer-break SED in two representative LRDs. It contrasts smooth and clumpy transfer models, displays ±1σ data shading, and annotates 16th–84th-percentile column ranges; the reported mismatch of the smooth model is therefore assessed against both line and continuum observables.
Original caption
Figure 1: H α \alpha , H β \beta , and Balmer-break fits for two representative LRDs. The top and bottom panels show fitting results of GN 9771 and A2744 45924, respectively. The columns show H α \alpha (left), H β \beta (middle), and the rest-frame SED around the Balmer break (right). Black curves represent the observational data, NIRSpec for H α \alpha & H β \beta and PRISM for the SED; grey shading indicates the ± 1 σ \pm 1\sigma uncertainty. The blue solid and red dashed lines are the best fits for the homogeneous and clumpy models, respectively. Fit in two steps: H α \alpha alone first, then H β \beta and the Balmer-break SED fits with N HI , n = 2 N_{\rm HI,\mathit{n}=2} prior from H α \alpha fit (see Methods). The median N HI , n = 2 N_{\rm HI,\mathit{n}=2} with its 16th–84th percentile range is annotated in each panel. Homogeneous SED fits that cannot produce the Balmer break (84th percentile of N HI , n = 2 N_{\rm HI,\mathit{n}=2} below 10 16.5 10^{16.5} cm -2 , i.e. Balmer-continuum optical depth τ BB < 0.5 \tau_{\rm BB}<0.5 ) are shown without uncertainties and labeled log N HI , n = 2 < 16.5 \log N_{\rm HI,\mathit{n}=2}<16.5 (see Methods). For both objects, N HI , n = 2 N_{\rm HI,\mathit{n}=2} from H α \alpha in the homogeneous model are too low to reproduce the observed H β \beta or the Balmer break, while the clumpy model provides N HI , n = 2 N_{\rm HI,\mathit{n}=2} values of H α \alpha consistent with both. Fits for the remaining 9 objects are shown in Extended Data Figures 3 and 4 .
Related research
Previous digest
Chang et al. use full radiative-transfer modeling of Hα and Hβ in 11 high-S/N JWST/NIRSpec little red dots, tying the line fits to independent n=2 neutral-hydrogen columns required by their Balmer breaks. A homogeneous gas screen fails this consistency test: its Hα-inferred column cannot reproduce the unusually deeper Hβ absorption in several objects and is typically about two orders of magnitude below the Balmer-break constraint. Optically thick, dense H I clumps embedded in diffuse hot ionized gas resolve both tensions, making multiphase structure a required ingredient in viable LRD models irrespective of whether their central engines are AGN or another compact power source.
Sources and evidence (26)
- 2610.34552v1: Multiphase Gas Structure in JWST Little Red Dots
JWST has uncovered a population of compact high-redshift galaxies, 'little red dots' (LRDs), exhibiting broad Balmer emission lines that often show narrow absorption features and strong Balmer breaks - spectral signatures attributed to dense gas surrounding rapidly growing black holes, but whose small-scale structure remains unknown. A striking feature of LRD spectra is that the H$β$ absorption is systematically deeper than H$α$, yet in any homogeneous gas this ordering is physically impossible. Here we model the H$α$ and H$β$ line profiles using radiative transfer simulations for 11 LRDs with JWST sensitive high resolution spectroscopy, and independently constrain the $n=2$ hydrogen column density, $N_{\rm HI,\mathit{n}=2}$, from the Balmer-break continuum. We find that the $N_{\rm HI,\mathit{n}=2}$ from H$α$ in a homogeneous medium cannot reproduce the observed H$β$ absorption in several objects, and that this $N_{\rm HI,\mathit{n}=2}$ typically falls two orders of magnitude below the lower bound set by the Balmer break. Both tensions are simultaneously resolved by a multiphase medium of dense clumps within diffuse hot ionized gas. This multiphase gas structure is a necessary ingredient for any viable LRD model, regardless of the nature of the central engine.
- 2610.34552v1: Multiphase Gas Structure in JWST Little Red Dots
Author contributions : S.-J.C. led the project, performed the radiative-transfer simulations, analyzed the simulated data, and modeled the Balmer lines and SED. M.G. contributed to building the fitting pipeline and to the scientific interpretation of the fitting results and their connection to the multiphase nature of the gas. J.M. provided the observed spectra for the sample of 11 LRDs, contributed to the interpretation of the data and to connecting the modeling results to LRD observations, and offered insight into how the results compare with other proposed LRD models. C.M. contributed to the observational interpretation of early-universe and LRD observations and to checking the models against recent observational results.
- 2610.34552v1: Multiphase Gas Structure in JWST Little Red Dots
Figure 1: H α \alpha , H β \beta , and Balmer-break fits for two representative LRDs. The top and bottom panels show fitting results of GN 9771 and A2744 45924, respectively. The columns show H α \alpha (left), H β \beta (middle), and the rest-frame SED around the Balmer break (right). Black curves represent the observational data, NIRSpec for H α \alpha & H β \beta and PRISM for the SED; grey shading indicates the ± 1 σ \pm 1\sigma uncertainty. The blue solid and red dashed lines are the best fits for the homogeneous and clumpy models, respectively. Fit in two steps: H α \alpha alone first, then H β \beta and the Balmer-break SED fits with N HI , n = 2 N_{\rm HI,\mathit{n}=2} prior from H α \alpha fit (see Methods). The median N HI , n = 2 N_{\rm HI,\mathit{n}=2} with its 16th–84th percentile range is annotated in each panel. Homogeneous SED fits that cannot produce the Balmer break (84th percentile of N HI , n = 2 N_{\rm HI,\mathit{n}=2} below 10 16.5 10^{16.5} cm -2 , i.e. Balmer-continuum optical depth τ BB < 0.5 \tau_{\rm BB}<0.5 ) are shown without uncertainties and labeled log N HI , n = 2 < 16.5 \log N_{\rm HI,\mathit{n}=2}<16.5 (see Methods). For both objects, N HI , n = 2 N_{\rm HI,\mathit{n}=2} from H α \alpha in the homogeneous model are too low to reproduce the observed H β \beta or the Balmer break, while the clumpy model provides N HI , n = 2 N_{\rm HI,\mathit{n}=2} values of H α \alpha consistent with both. Fits for the remaining 9 objects are shown in Extended Data Figures 3 and 4 .
- 2610.34552v1: Multiphase Gas Structure in JWST Little Red Dots
Table 3: Balmer-break SED fitting results for all 11 LRDs. α UV \alpha_{\rm UV} : UV power-law slope from Stage 1. T BB T_{\rm BB} : effective optical continuum temperature from Stage 2; this is a fitting parameter, not a physical temperature (see text). f exc f_{\rm exc} : optical-excess parameter (equation 1 ); these three columns do not depend on the H i velocity model. log N HI , n = 2 \log\,N_{\rm HI,\mathit{n}=2} and v ran v_{\rm ran} are the Stage-3 high-n Balmer series fit values (see text), reported separately for the clumpy and homogeneous models since each is fit with its own model-specific H α \alpha -derived prior on log N HI , n = 2 \log\,N_{\rm HI,\mathit{n}=2} . Superscripts/subscripts give the 84th/16th percentiles of the Stage-1, Stage-2, and Stage-3 posteriors. The last two rows (GS 3073 and JADES GN 38147) did not satisfy the detection criterion ( f exc < 1 f_{\rm exc}<1 ); dashes indicate that the Stage-3 high-n Balmer series fit is not meaningful for these objects. For JADES GN 38147, the optical excess is too weak to constrain T BB T_{\rm BB} . ‡ \ddagger : the 84th percentile of N HI , n = 2 N_{\rm HI,\mathit{n}=2} is below 10 16.5 10^{16.5} cm -2 ( τ BB = 0.5 \tau_{\rm BB}=0.5 ), too low to produce the Balmer break; the median is given and v ran v_{\rm ran} is unconstrained.
- 2610.34552v1: Multiphase Gas Structure in JWST Little Red Dots
JWST has revealed compact sources at z ∼ 4 z\sim 4 –9, ‘little red dots’ (LRDs), with red optical continua, broad Balmer emission lines of several thousand km s -1 , Balmer breaks, and Balmer absorption Matthee et al. (2024) ; Greene et al. (2024) ; Kocevski et al. (2023) ; Kokorev and others (2024) ; Setton et al. (2024) ; Juodžbalis et al. (2024) ; Labbe et al. (2024) ; Hviding et al. (2025) , the latter seen in ∼ \sim 60% of LRDs with deep spectra Matthee et al. (2026) ; Juodžbalis et al. (2026) ; Davis et al. (2026) . They are widely interpreted as rapidly accreting black holes in dense gas, but their nature remains debated: models invoke dense gas cocoons Rusakov et al. (2025) ; Inayoshi and Maiolino (2025) ; Kido et al. (2025) ; Sneppen and others (2026) ; Naidu et al. (2026) , super-Eddington accretion Madau and Maiolino (2026) ; Chon et al. (2026b) , and dust-free black-hole atmospheres Naidu et al. (2025) ; de Graaff et al. (2025) . In most of these scenarios, scattering of Balmer lines through dense gas plays a central role in shaping the observed spectra Chang et al. (2026) , but thus far, observed Balmer line profiles have not been confronted with radiative transfer models with scattering physics.
- 2610.34552v1: Multiphase Gas Structure in JWST Little Red Dots
Table 4: Homogeneous (smooth) model fitted parameters. Median and 68 percent credible intervals for all 11 LRDs, from the individual-fit chain (see Methods): for each object, the H α \alpha row is the H α \alpha -only fit; the H β \beta row is the H β \beta fit using the N HI , n = 2 N_{\rm HI,\mathit{n}=2} posterior of this H α \alpha fit as a prior. Object order as in Fig. 2 . Italicized rows (GS 3073 and JADES GN 38147) have no Balmer-break detection; line-fitting results are included for completeness. v exp v_{\rm exp} : envelope expansion velocity (negative values indicate infall). σ emit \sigma_{\rm emit} : intrinsic emission-line width. σ ran \sigma_{\rm ran} : random velocity dispersion. τ Th \tau_{\rm Th} : Thomson optical depth. χ r 2 \chi^{2}_{\rm r} : χ 2 \chi^{2} of the median posterior model per spectral bin ( | v | < 3000 |v|<3000 km s -1 for H α \alpha , < 2000 <2000 km s -1 for H β \beta ).
- 2610.34552v1: Multiphase Gas Structure in JWST Little Red Dots
The H α \alpha and H β \beta resonance cross-sections at line center differ by a factor of ≈ 5.7 \approx 5.7 (the ratio of oscillator strengths times wavelength; Chang et al. (2026) equations 3 and 4), so that H α \alpha photons experience substantially higher opacity than H β \beta at the same N HI , n = 2 N_{\rm HI,\mathit{n}=2} . In the clumpy case, H α \alpha photons scatter predominantly off the near surface of each clump and escape without penetrating to high column density ( surface scattering ), whereas H β \beta photons penetrate more deeply and are subject to a branching decay at the 4 p 4p level ( BR n = 3 ≈ 0.26 \rm{BR}_{n=3}\approx 0.26 ; Chang et al. (2026) Table 3 and Fig. 4) that removes them from the H β \beta line before re-emission. This mechanism allows the clumpy model to simultaneously reproduce both lines with a single N HI , n = 2 N_{\rm HI,\mathit{n}=2} , including cases where H β \beta absorption is deeper than H α \alpha . The asymmetry is atomic in origin: the 3 p → 1 s 3p\to 1s (Ly β \beta ) decay is immediately reabsorbed by ground-state hydrogen, so a scattered H α \alpha photon is ultimately re-emitted as H α \alpha , whereas the 4 p 4p level also decays to 3 s 3s and 3 d 3d , which cascade through 2 p 2p and emit Pa α \alpha and H α \alpha instead of H β \beta . With BR 3 ≈ 0.26 {\rm BR}_{3}\approx 0.26 per scattering, 1 − ( 1 − BR 3 ) 4 ≈ 70 % 1-(1-{\rm BR}_{3})^{4}\approx 70\% of H β \beta photons are converted after four scatterings.
- 2610.34552v1: Multiphase Gas Structure in JWST Little Red Dots
The continuum is first removed from each spectrum using the continuum model of Matthee et al. (2026) , derived from a spectral decomposition of the full JWST NIRSpec grating spectrum. The narrow host-galaxy emission in H α \alpha and H β \beta is then subtracted. For each object, the [O iii ] λ 5007 \lambda 5007 profile is used as a host template for both Balmer lines: F host , H β ( v ) = F [ OIII ] ( v ) / R H β F_{\rm host,H\beta}(v)=F_{\rm[OIII]}(v)/R_{\rm H\beta} and F host , H α ( v ) = F [ OIII ] ( v ) / R H α F_{\rm host,H\alpha}(v)=F_{\rm[OIII]}(v)/R_{\rm H\alpha} , where R H β ≡ F [ OIII ] / F H β , host R_{\rm H\beta}\equiv F_{\rm[OIII]}/F_{\rm H\beta,host} and R H α ≡ F [ OIII ] / F H α , host R_{\rm H\alpha}\equiv F_{\rm[OIII]}/F_{\rm H\alpha,host} are the host [O iii ]-to-Balmer line ratios. Both are free parameters. For R H β R_{\rm H\beta} we adopt a Gaussian prior on log 10 R H β \log_{10}R_{\rm H\beta} centered on the median [O iii ]/H β \beta ratio of high-z galaxies at the redshift of each object Cooper et al. (2026) , with a width of 0.15 dex Cameron et al. (2023) , truncated so that the subtracted host does not drive the observed H β \beta and H α \alpha line cores below zero beyond their observational uncertainties. The host Balmer decrement, R H β / R H α R_{\rm H\beta}/R_{\rm H\alpha} , is allowed to vary between 2.6 and 3.3 (Case B with mild departures). A third free parameter, Δ v \Delta v , is a single velocity offset shared by both lines between the [O iii ]-derived host/narrow-line-region zero point and the true center of the LRD’s own broad-line/clumpy-gas structure; it has a Gaussian prior centered at zero with width set in quadrature from that object’s own [O iii ] line width and the instrumental resolution.
- 2610.34552v1: Multiphase Gas Structure in JWST Little Red Dots
We infer posterior distributions for all free parameters using Markov chain Monte Carlo (MCMC) sampling via the affine-invariant ensemble sampler emcee Foreman-Mackey et al. (2013) . At each proposed parameter vector, the model line profiles are evaluated at continuous parameter values via a principal-component-analysis emulator trained on the precomputed rt-scat grid, allowing the sampler to explore the full parameter space between grid points. Each χ 2 \chi^{2} is evaluated over the velocity windows | v | ≤ 3000 |v|\leq 3000 km s -1 (H α \alpha ) and | v | ≤ 2000 |v|\leq 2000 km s -1 (H β \beta ) using an optimal linear normalisation A = ( ∑ i O i M i σ i − 2 ) / ( ∑ i M i 2 σ i − 2 ) A=(\sum_{i}O_{i}M_{i}\sigma_{i}^{-2})/(\sum_{i}M_{i}^{2}\sigma_{i}^{-2}) sensitive only to line profile shape. The per-pixel uncertainty is σ i 2 = σ obs , i 2 + σ jig , i 2 \sigma_{i}^{2}=\sigma_{{\rm obs},i}^{2}+\sigma_{{\rm jig},i}^{2} , where σ obs \sigma_{\rm obs} is the pipeline error and σ jig , i = σ MAD F ref | f i | \sigma_{{\rm jig},i}=\sigma_{\rm MAD}\sqrt{F_{\rm ref}\,|f_{i}|} is a conservative allowance for residual spectral structure not captured by it. Here σ MAD \sigma_{\rm MAD} is the scatter of each line’s wings ( 1500 < | v | < 5000 1500<|v|<5000 km s -1 ) about a symmetric exponential profile, commonly used to describe the broad wings of LRD Balmer lines Laor (2006) ; Rusakov et al. (2025) , and F ref F_{\rm ref} is the median wing flux at 3000 < | v | < 5000 3000<|v|<5000 km s -1 . Model spectra are convolved to the instrumental resolution prior to comparison ( ℛ = 2700 \mathcal{R}=2700 for G235H/G395H, ℛ = 1000 \mathcal{R}=1000 for G235M/G395M).
- 2610.34552v1: Multiphase Gas Structure in JWST Little Red Dots
For each stage, we run 128 walkers for 50,000 steps in Stage 1 and 64 walkers for 20,000 steps in Stage 2 per object per model, initialized at random positions within the prior ranges; the first 5,000 steps are discarded as burn-in, and marginalized 68% credible intervals are derived from the remaining samples. Full spectral fits for all objects are shown in Extended Data Fig. 3 and 4 . Marginalized log N HI , n = 2 \log\,N_{\rm HI,\mathit{n}=2} posteriors are shown in Extended Data Fig. 5 and 6 . Fitted parameters for all 11 objects are listed in Extended Data Tables 4 and 5 .
- 2503.16595v1: Little red dots as young supermassive black holes in dense ionized cocoons
All best-fit results in this paper were produced using the Monte Carlo Markov Chain (MCMC) NUTS sampler in PyMC v. 5.17.0 [ 16 ] , except Objects A and D, which were fitted using the Ensemble sampler in emcee v. 3 [ 17 ] (due to an incompatibility of the P Cygni model used here with the tensor formalism in PyMC ). We sampled the posterior distributions with 4 k 4k walkers (where k k is the number of free parameters) and 10 5 10^{5} samples per walker. We use the mode values of the posterior parameter distributions as the best values and the 68%-highest density interval as the range of uncertainty. Finally, we find that the resolution of NIRSpec gratings is higher than the nominal value. Using the resolved widths of narrow [O iii ] lines in the high-resolution G235H grating of Object A, we estimate that the medium resolution grating G235M has ∼ 1.7 \sim 1.7 times higher R R than the nominal value. This scaling factor on R R has been assumed for G395M and also for the G395H grating, as supported by recent instrument modelling [ 18 ] for a point source.
- 2503.16595v1: Little red dots as young supermassive black holes in dense ionized cocoons
The high density gas reprocesses essentially all of the Lyman continuum radiation from the central source, resulting in extremely high Lyman optical depths that cause the self-reversal seen as absorption in the line centres of some of the Balmer lines. The bulk of the ionizing flux from the AGN is therefore emitted in the Balmer and Paschen regions of the spectrum, implying that nebular gas emission must be a major component of the optical and NIR spectra of these sources, giving rise to Balmer, Paschen and He i emission lines and continua and the two-photon continua that would dictate the spectral shape [ 13 , 40 ] . In addition, while many of these systems appear in blue star-forming galaxies based on the spatially-extended nebulosity surrounding the point source [ 41 ] , many may be entirely dominated by the nebular emission at optical and even near UV wavelengths. We also note that our inferred electron-scattering optical depths are all τ e ∼ 1 \tau_{e}\sim 1 (see Extended Data Fig. 8 ). This suggests three things. First, that there may be a population that is even more heavily obscured, suppressing line emission due to self-absorption, and giving rise to spectra that appear in absorption rather than emission, including a Balmer break instead of a jump. Second, it also suggests that the gas distribution is close to spherical without a large opening, because scattered light will be preferentially emitted along the lowest column density sightlines. The fact that we are not detecting large numbers of low-mass, rapidly accreting AGN without these signatures indicates that LRDs are the primary population and that the gas cocoon in these SMBHs is a near-universal, young phase of their accretion-powered growth. Third, that the line ratios of the Balmer lines should be very different from the standard case B values due to very high Lyman optical depths [ 42 ] , so that high H α \alpha /H β \beta ratios do not imply dust extinction.
- 2604.03563v1: SPURS: Evidence for Clumpy Neutral Envelopes and Ionized IGM Surrounding Little Red Dots in Abell 2744 from Ultra-Deep Rest-UV Spectroscopy
Ly α \alpha emission has been detected in many LRDs [ 147 , 9 , 198 ] , including several at z > 7 z>7 [ 55 , 95 , 136 ] . However, most interpretation to date of these lines has been limited by the low resolution of NIRSpec prism spectroscopy. Our ultra-deep G140M spectroscopy of Abell2744-QSO1, a z = 7.04 z=7.04 LRD, has revealed high EW Ly α \alpha emission with a remarkably similar profile to the broad H α \alpha line. This detection is striking on two levels. Firstly, the Ly α \alpha profile is incompatible with the high H I column density ( N HI ∼ 10 24 N_{\rm HI}\sim 10^{24} cm -2 ) typically invoked to explain LRDs’ Balmer breaks and Balmer absorption features [ 36 , 86 , 93 , 137 , 193 , 183 , e.g.] : Ly α \alpha would be redshifted to > 2000 >2000 km s -1 to escape such high N HI N_{\rm HI} gas. Secondly, due to the increasingly neutral IGM, at z > 7 z>7 high EW Ly α \alpha ( ≳ 100 \gtrsim 100 Å) is typically only expected from sources in large ionized bubbles [ 119 , 192 , 141 , 30 , e.g.,] . Here we discuss the implications of our results for the environments of LRDs during reionization (Section V.1 ) and for the interpretation of dense gas around LRDs (Section V.2 ).
- 2604.03563v1: SPURS: Evidence for Clumpy Neutral Envelopes and Ionized IGM Surrounding Little Red Dots in Abell 2744 from Ultra-Deep Rest-UV Spectroscopy
1. With deep medium-resolution spectrum, we characterize the Ly α \alpha velocity profile of Abell2744-QSO1. The Ly α \alpha profile appears to be the superposition of a narrow host-like component (FWHM = 333 =333 km s -1 ) offset by + 258 +258 km s -1 from line center, and a broad component (FWHM = 1498 =1498 km s -1 ) offset by + 1015 +1015 km s -1 . The FWHM of broad Ly α \alpha is 5 − 10 × 5-10\times larger than that of galaxies with similar UV luminosities (M UV = − 16.9 {}_{\rm UV}=-16.9 ) at z > 6 z>6 , suggesting that the Ly α \alpha powering and scattering mechanisms are not typical of star-forming galaxies. The broad Ly α \alpha line width is similar to that of the red-side wing of the broad H α \alpha line, indicating that the broad Ly α \alpha may be linked to the mechanism that is producing the broad Balmer lines.
- 2503.16596v1: A "Black Hole Star" Reveals the Remarkable Gas-Enshrouded Hearts of the Little Red Dots
Table Extended Data 1: Summary of key properties.
- 2503.16596v1: A "Black Hole Star" Reveals the Remarkable Gas-Enshrouded Hearts of the Little Red Dots
We thank the PRIMER and EXCELS teams for designing JWST surveys that made this work possible. We acknowledge feedback on ”BH*” and illuminating discussions with Ivan Cabrera-Ziri, Mike McDonald, Roger Blandford, Susan Clark, Risa Wechsler, Tom Abel, Mike Liu, Dave Sanders, Sylvain Veilleux, Triana Almeyda, Adam Ginsburg, and Desika Narayanan. We thank Kohei Inayoshi for discussing details of their work modeling Balmer breaks in LRDs [ 8 ] . This work is based on observations made with the NASA/ESA/CSA James Webb Space Telescope. The data were obtained from the Mikulski Archive for Space Telescopes at the Space Telescope Science Institute, which is operated by the Association of Universities for Research in Astronomy, Inc., under NASA contract NAS 5-03127 for JWST. These observations are associated with programs 5224 and 3543. Some of the data products presented herein were retrieved from the Dawn JWST Archive (DJA). DJA is an initiative of the Cosmic Dawn Center (DAWN), which is funded by the Danish National Research Foundation under grant DNRF140. We acknowledge funding from JWST programs GO-3516, GO-5224, and GO-1837. Support for this work was provided by NASA through the NASA Hubble Fellowship grant HST-HF2-51515.001-A awarded by the Space Telescope Science Institute, which is operated by the Association of Universities for Research in Astronomy, Incorporated, under NASA contract NAS5-26555. Funded by the European Union (ERC AGENTS, 101076224; HEAVYMETAL, 101071865; RED CARDINAL, 101076080). Views and opinions expressed are however those of the author(s) only and do not necessarily reflect those of the European Union or the European Research Council. Neither the European Union nor the granting authority can be held responsible for them. This work has received funding from the Swiss State Secretariat for Education, Research and Innovation (SERI) under contract number MB22.00072, as well as from the Swiss National Science Foundation (SNSF) through project grant 200020_207349. This work was also supported by JSPS KAKENHI Grant Numbers 23H00131. The Cosmic Dawn Center is funded by the Danish National Research Foundation under grant DNRF140. P.N. acknowledges supp
- 2601.18864v1: Inside the cocoon: a comprehensive explanation of the spectra of Little Red Dots
Accounting for electron-scattering broadening, we find the intrinsic width of the broad lines in our sample. Standard AGN scaling relations ( [ 65 ] ) imply SMBH masses log 10 ( M / M ⊙ ) = 5.0 − 7.0 \log_{10}(M/M_{\odot})=5.0{-}7.0 . By contrast, Sirocco does not rely on a luminosity–size scaling: the recombination luminosity and measured column density set the cocoon scale, while the unscattered broad-line width gives the Keplerian velocity at that scale. Matching the unscattered components in the sample to our models yields log 10 ( M / M ⊙ ) = 5.7 ± 0.8 \log_{10}(M/M_{\odot})=5.7\pm 0.8 (median with 1 σ \sigma percentiles). For our sample luminosities, this implies Eddington ratios of log 10 ( L / L e d d ) = − 0.2 − 0.9 + 1.2 \log_{10}(L/L_{edd})=-0.2_{-0.9}^{+1.2} , implying that most of our sample is accreting close to the Eddington limit. The mass of gas in the ionized cocoon is small: 1 − 100 1-100 M ⊙ (see Sect. B.3 ). Typical electron temperatures vary across the cocoon from about 4000 K to about 10 000 K. The hydrogen column densities range from about 10 24 10^{24} cm -2 to a few 10 25 10^{25} cm -2 . As mentioned above the dust content in the ionized cocoon is extremely low, essentially negligible. Velocities are ≲ 100 \lesssim 100 km s -1 in the inflow, up to 400 km s -1 in the outflow and these two components contain comparable mass-flows.
- 2601.18864v1: Inside the cocoon: a comprehensive explanation of the spectra of Little Red Dots
consistent with the reverberation-tracked photon delays in the Sirocco models. Multi-epoch JWST studies find LRDs are photometrically steady as a population ( [ 34 , 69 ] ), although individual lensed systems do vary: A2744-QSO1 shows broad-line equivalent-width changes at the ∼ 20 % \sim 20\% level over 2.4 yr rest-frame ( [ 70 ] ), and R2211-RX1 shows intrinsic colour and brightness variations on 10–100 yr timescales ( [ 71 ] ). A prediction of our model is that variability should appear on longer timescales only, and most strongly in the unscattered cores of the broad lines.
- 2512.11050v1: Balmer Transition Signatures from Gas-Enshrouded, Dust-Poor Active Galactic Nuclei
In summary, the Balmer decrement can be approximated as
- 2512.11050v1: Balmer Transition Signatures from Gas-Enshrouded, Dust-Poor Active Galactic Nuclei
The analytical formula of the Balmer decrement agrees well with the numerical results shown in Figure 2 , while the high-density part underestimates the flux ratio by a factor of 1.8. The column-density dependence is also broadly consistent with the numerical results.
- 2606.03522v1: The UV Side of Little Red Dots: Red, Compact, and Iron-Enhanced Rest-UV Emission with a Strong Downturn around Ly$α$
Figure 3: Relative values of the UV slopes of the LRDs against those calculated from the M UV M_{\mathrm{UV}} - β UV \beta_{\mathrm{UV}} relation of normal SFGs, Δ β UV = β UV , LRD − β UV , base \Delta\beta_{\mathrm{UV}}=\beta_{\mathrm{UV,\,LRD}}-\beta_{\mathrm{UV,\,base}} , color-coded by redshift. The histograms of M UV M_{\mathrm{UV}} and Δ β UV \Delta\beta_{\mathrm{UV}} are shown in the top and right subplots, respectively. The black dotted and red dashed horizontal lines indicate zero and median Δ β UV \Delta\beta_{\mathrm{UV}} values, respectively. A positive (negative) Δ β UV \Delta\beta_{\mathrm{UV}} means that a given LRD has redder (bluer) UV slope compared to an average star-forming galaxy with a similar redshift and M UV M_{\mathrm{UV}} . The Δ β UV \Delta\beta_{\mathrm{UV}} distribution is clearly skewed towards the positive values with the median value of 0.60 0.60 , indicating that LRDs have redder UV slopes compared to normal star-forming galaxies at a population level.
- 2606.03522v1: The UV Side of Little Red Dots: Red, Compact, and Iron-Enhanced Rest-UV Emission with a Strong Downturn around Ly$α$
In the right panel of Figure 12 , we compare the EWs of Fe ii . We find that LRDs with redder UV slopes have larger EW ( Fe ii ) \mathrm{EW(Fe\,\text{{\sc ii}})} . These results may imply that BH activities are similar across different LRD subsamples, but the relative contributions of the host galaxy greatly differ. We discuss this point in the Section V.1 .
- 2507.07190v1: The Balmer Break and Optical Continuum of Little Red Dots from Super-Eddington Accretion
In summary, we adopt the approximate model because it is computationally tractable in the super-Eddington regime and because it does not show any physically unstable density inversion. As a caveat, we do not expect the model to represent a realistic annulus structure, which requires dedicated simulations especially in the presence of turbulence.
- 2507.07190v1: The Balmer Break and Optical Continuum of Little Red Dots from Super-Eddington Accretion
Another notable feature in Figure 2 is that the minimum effective opacity ratio of each curve is consistently of the order 0.1 0.1 even as the optimal temperature changes from ∼ 10000 K \sim 10000{\rm~K} to ∼ 5000 K \sim 5000{\rm~K} across different densities. This result appears counterintuitive, since the fraction n 2 / n H n_{2}/n_{\rm H} and hence κ 2 → ∞ \kappa_{2\to\infty} steeply increase with temperature as exp ( − 3 I 0 / 4 k B T ) \exp(-3I_{0}/4k_{B}T) before ionization occurs. However, near the optimal temperature, we observe that the continuum absorption opacity at ∼ 4000 Å \sim 4000{\rm~\AA} is dominated by the photoionization opacity of hydrogen with n = 3 n=3 . The latter similarly increases with temperature as exp ( − 8 I 0 / 9 k B T ) \exp(-8I_{0}/9k_{B}T) . Therefore, both the numerator and the denominator of the opacity ratio are diminished at lower density and temperature, and their ratio, which is proportional to exp ( − 5 I 0 / 36 k B T ) \exp(-5I_{0}/36k_{B}T) , is relatively insensitive to temperature. This maintains a strong opacity contrast and makes a Balmer break theoretically plausible at an optimal temperature of ∼ 5000 K \sim 5000{\rm~K} .
- 2509.09607v1: Discovery of Multiply Ionized Iron Emission Powered by an Active Galactic Nucleus in a z~7 Little Red Dot
We measure three Balmer lines: H α \mathrm{H}{\alpha} , H β \mathrm{H}{\beta} , and H γ \mathrm{H}{\gamma} . The detailed line decomposition procedure is reported in the Methods; in brief, we find complex line component features within the Balmer lines. In summary, all detected Balmer lines contain evidence of at least one broad component tracing gas at ∼ \sim 3000 km s -1 via the FWHMs of the respective features. The Balmer emission lines are significantly broad-line dominated – with narrow components comprising only a marginal percentage of their total flux. Though we note the H β \mathrm{H}{\beta} and H α \mathrm{H}{\alpha} complexes have strong central absorption components, this yields a significant degeneracy in accurately decomposing the narrow line components at their respective line centers. Figure 2 highlights the and respective multicomponent fits to the three detected Balmer lines.
- 2509.09607v1: Discovery of Multiply Ionized Iron Emission Powered by an Active Galactic Nucleus in a z~7 Little Red Dot
In summary, we report the first discovery of several rare iron transitions, including a possible [Fe vii ] λ 5160 \lambda 5160 detection, in the little red dot THRILS_46403 at z = 6.68476 z=6.68476 . We also measure significant narrow Balmer absorption in both H α \mathrm{H}{\alpha} and H β \mathrm{H}{\beta} . The small velocity widths of the absorber, in conjunction with the detected lines that require direct, unobscured attenuation from the accretion disk, indicate that the source of the absorber is on scales at (or beyond) the broad-line gas region and a covering fraction that does not completely occlude the broad-line region.
Abstract
JWST has uncovered a population of compact high-redshift galaxies, 'little red dots' (LRDs), exhibiting broad Balmer emission lines that often show narrow absorption features and strong Balmer breaks - spectral signatures attributed to dense gas surrounding rapidly growing black holes, but whose small-scale structure remains unknown. A striking feature of LRD spectra is that the H$β$ absorption is systematically deeper than H$α$, yet in any homogeneous gas this ordering is physically impossible. Here we model the H$α$ and H$β$ line profiles using radiative transfer simulations for 11 LRDs with JWST sensitive high resolution spectroscopy, and independently constrain the $n=2$ hydrogen column density, $N_{\rm HI,\mathit{n}=2}$, from the Balmer-break continuum. We find that the $N_{\rm HI,\mathit{n}=2}$ from H$α$ in a homogeneous medium cannot reproduce the observed H$β$ absorption in several objects, and that this $N_{\rm HI,\mathit{n}=2}$ typically falls two orders of magnitude below the lower bound set by the Balmer break. Both tensions are simultaneously resolved by a multiphase medium of dense clumps within diffuse hot ionized gas. This multiphase gas structure is a necessary ingredient for any viable LRD model, regardless of the nature of the central engine.
Discussion
Discussion access requires a security token. Register for the weekly digest.