2610.06680v1 · First listed 2026-10-06
Unveiling the Origins of the Molecular Gas Reservoirs in Recently Quenched Massive Galaxies
In Simba, apparently molecular-gas-rich recently quenched galaxies can reflect dust-hidden star formation, a low CO–H2 conversion factor, or temporary quiescence. The model favors no single explanation; rejuvenation is high-redshift-weighted and comparatively uncommon. [1][7]
Evidence
The study analyzes Simba galaxies with M⋆>3×10^9 M⊙ over z=0–2, classifying star-forming state with sSFR×tH and using a UBV post-starburst-like color cut as an observational analogue. It evaluates three explanations for gas-rich low-SFR systems: later rejuvenation, CO-based gas-mass bias, and dust-obscured star formation. The authors report mean τV rising from about 0.5 to 2.3 from z=0 to 2; adopting Milky-Way αCO would overestimate H2 by about fivefold in non-star-forming systems, versus about 1.45-fold in star-forming ones. Their αCO–sSFR regression includes bootstrap 95% confidence intervals, but is a simulation-calibrated relation rather than a direct observational measurement. Rejuvenation occurs on 0.1–2 Gyr timescales and is reported as rare overall, despite being more important at high redshift. [1][4][7]
Earlier work
The authors’ comparison to earlier EAGLE post-starburst modeling is concrete: EAGLE “imposter PSBs” had 0.6–1.2 Gyr depletion times, whereas Simba UBV-selected objects at z=0.5 have median 798 Myr when also classified star-forming; Simba objects simultaneously UBV-selected and quenched have a longer median of roughly 2 Gyr. This is broadly consistent with the cited EAGLE result that post-starbursts lose about 90% of star-forming ISM within roughly 600 Myr after a burst, while emphasizing that photometric PSB selection can mix physically distinct populations. [5][6]
What changes
Rather than treating molecular gas in quenched galaxies as one anomaly, the paper tests three competing, potentially coexisting interpretations in one simulation framework. It further connects the selection problem to observables: UBV-selected systems peak at z=2 in the modeled sample, and dust-rich selected galaxies can have IR SFRs that track their true SFR while UV SFRs underpredict it. The authors also find that their sSFR-based low-SFR selection is more H2-rich than an SFMS-offset selection, a choice that directly affects the inferred prevalence of gas-rich quiescence. [3][8][1]
Limits and open questions
The conclusions depend on Simba’s gas, dust, merger, and CO-conversion modeling and on selection definitions. In particular, the adopted sSFR×tH criterion deliberately returns a more gas-rich low-SFR sample than an SFMS-based cut, so results should not be read as selection-independent population fractions. The supplied text does not provide the full αCO prescription, resolution tests, or a quantitative decomposition of how much each of the three mechanisms contributes at each redshift. The authors explicitly state that further work is needed to separate their relative roles. [10][8][1]
Main-paper HTML excerpts and figure captions were supplied, so this is not abstract-only. Extraction does not include the full simulation setup, αCO prescription, resolution/convergence tests, or the complete text of the Fig. 6 caption.
Key figures
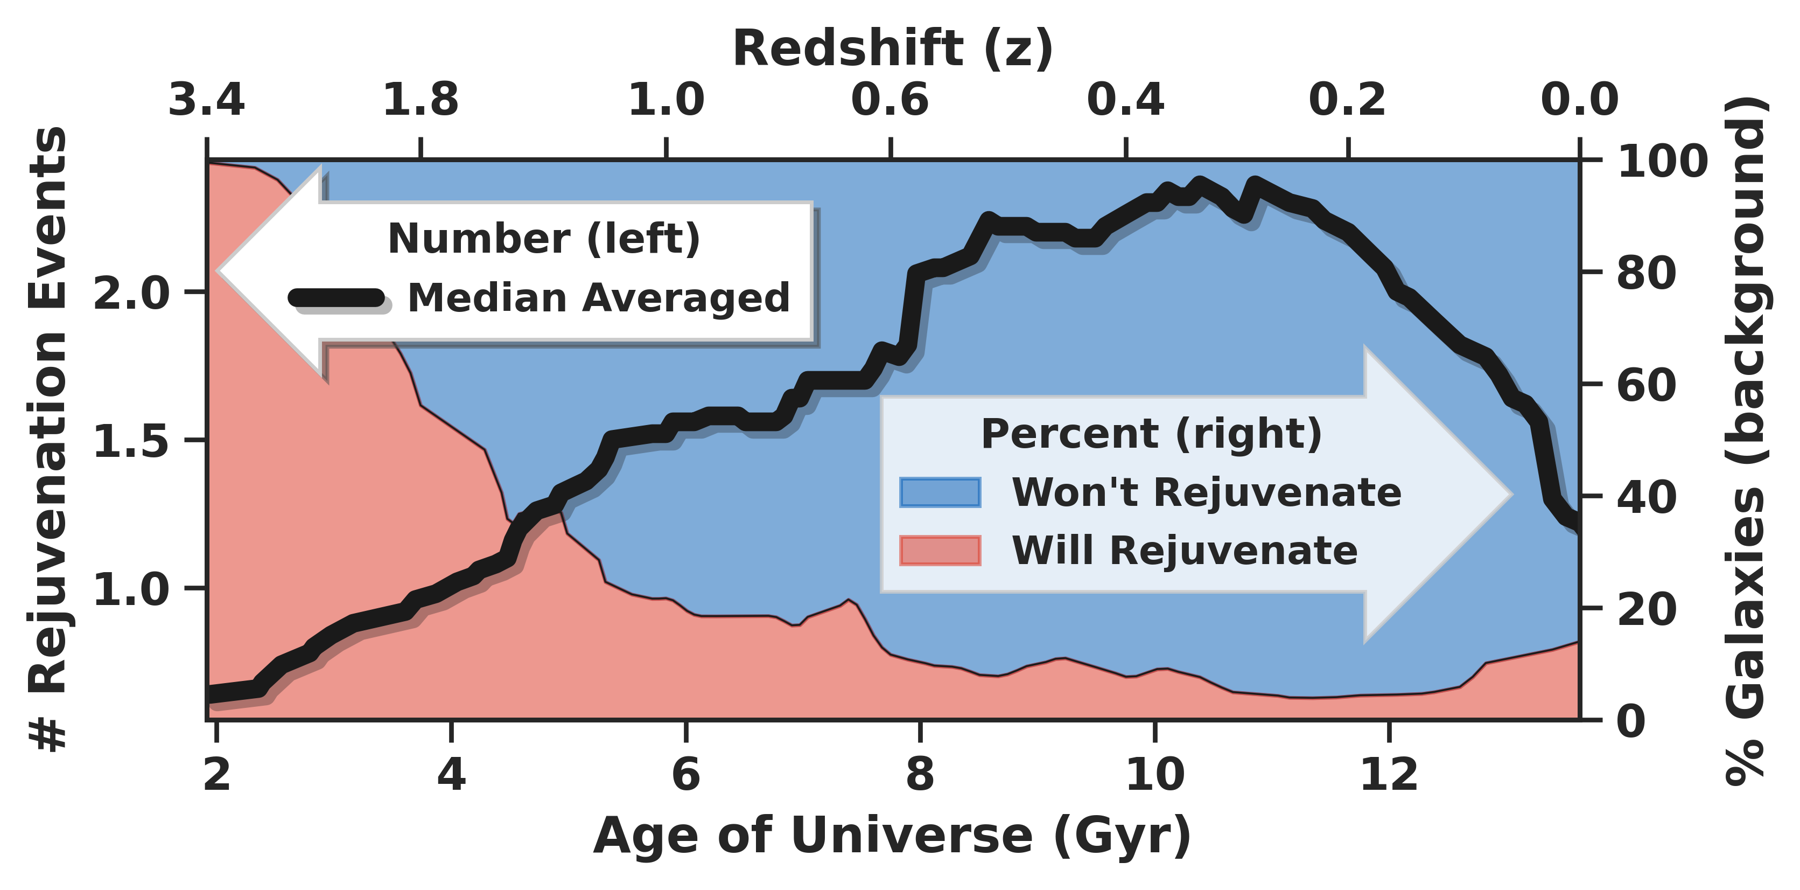
Tests the redshift dependence of rejuvenation by separating the number of identified events from the fraction of transitioning/quenched galaxies that later rejuvenate; the latter declines toward z=0 in the model.
Original caption
Figure 3: While the median number of rejuvenation events tends to increase toward present day, the fraction of M ∗ > 𝟑 × 𝟏𝟎 𝟗 M ⊙ \bm{M_{*}>3\times 10^{9}M_{\odot}} galaxies with sSFR × t H < 0.7 \bm{\text{sSFR}\times\text{t}_{\text{H}}<0.7} that will rejuvenate instead decreases over the same redshift range. The number of rejuvenation events at each snapshot is shown as a black line (left y y -axis). Here, we see low values at high- z z , due to the rarity of high-mass transitioning and quenched systems at these epochs, as described in § II.3 / II.3.1 . Additionally, we see another turnover at low- z z , occurring around z ∼ 0.4 z\sim 0.4 ( t H ∼ 10 \text{t}_{\text{H}}\sim 10 Gyr); this arises because galaxies identified within the last few Gyr of cosmic time simply have not had enough time to undergo the ∼ 2 \sim 2 Gyr rejuvenation process. In contrast, the fraction of our massive transitioning or quenched galaxies that will rejuvenate, indicated by the red region (right y y -axis) is highest at high- z z , and decreases monotonically towards z = 0 z=0 . The reason for this trend is that rejuvenation is primarily driven by galaxy interactions, which in this redshift/mass range are most common around z ∼ 3 z\sim 3 , with decreasing rates towards lower z z .
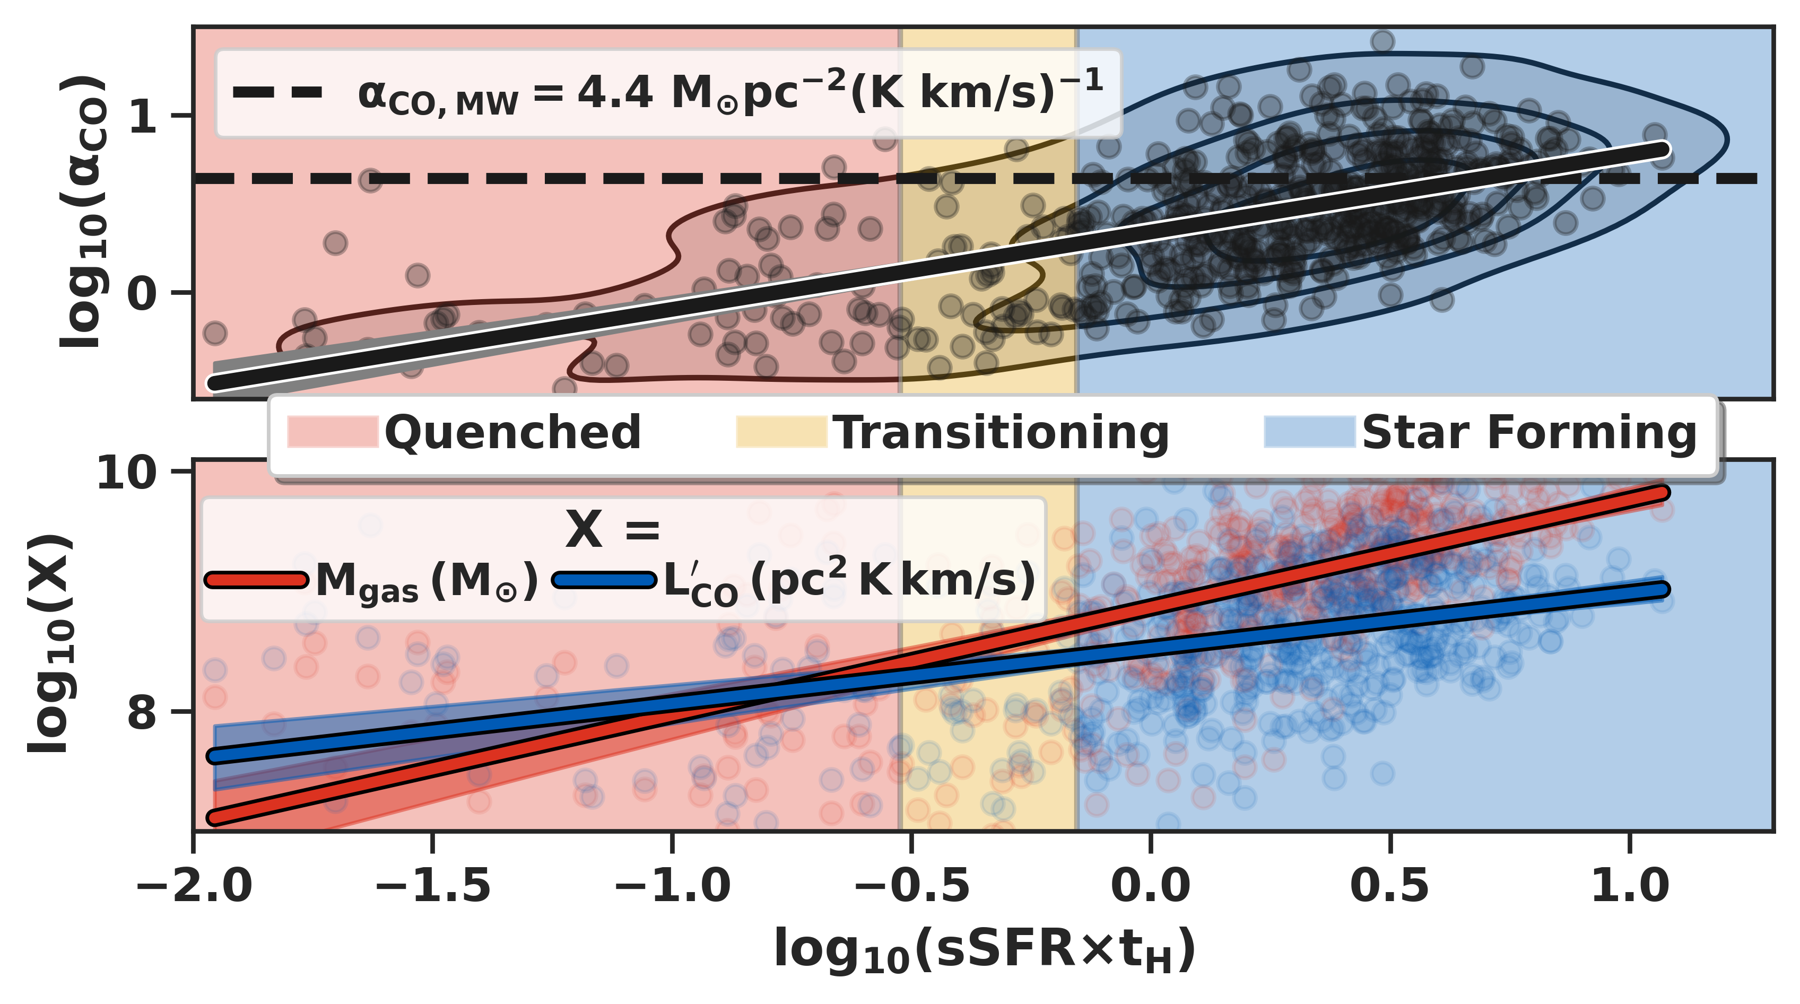
Tests whether αCO covaries with star-formation state for all massive z=0 and 1 galaxies. A bootstrapped linear fit shows lower-than-Milky-Way αCO for quenched, transitioning, and weakly star-forming systems.
Original caption
Figure 6: ( Top ) The value of α CO \bm{\alpha_{\text{CO}}} increases with sSFR × t H \bm{\text{sSFR}\times\text{t}_{\text{H}}} such that systems with low levels of star-formation will typically have a less than MW-like value of the CO- H 𝟐 \bm{\text{H}_{2}} conversion factor ( α CO < α CO,MW \bm{\alpha_{\text{CO}}<\alpha_{\text{CO,MW}}} ), implying observers who assume α CO = α CO,MW \bm{\alpha_{\text{CO}}=\alpha_{\text{CO,MW}}} would overestimate M H 𝟐 \bm{M_{\text{H}_{2}}} . All massive ( M ∗ > 3 × 10 9 M ⊙ ) (M_{*}>3\times 10^{9}M_{\odot}) galaxies are shown here for z = 0 , 1 z=0,1 , with their logarithmic value of sSFR × t H \text{sSFR}\times\text{t}_{\text{H}} on the x x -axis and α CO \alpha_{\text{CO}} on the y y -axis (in units M ⊙ pc − 2 ( K km / s ) − 1 \mathrm{M_{\odot}\,pc^{-2}(K~km/s)^{-1}} ). As in previous plots, the background shading corresponds to our star-forming classification scheme from § II.3.1 , in which the blue background corresponds to galaxies that are star-forming (Eq. 2 ), yellow for transitioning (Eq. 3 ), and red for quenched (Eq. 4 ). The black line shown here is a linear regression model fit to our data, while the shaded region surrounding it is the associated 95% confidence interval, estimated using bootstrap resampling. From this, we see a trend in which α CO \alpha_{\text{CO}} is lower than α CO,MW \alpha_{\text{CO,MW}} for quenched and transitioning galaxies, and only surpasses this for the most actively star-forming galaxies ( sSFR × t H > 5 \text{sSFR}\times\text{t}_{\text{H}}>5 ). ( Bottom ) The reason that higher levels of star-formation correlate with higher α CO \bm{\alpha_{\text{CO}}} stems from the fact that as a function of increasing sSFR × t H \bm{\text{sSFR}\times\text{t}_{\text{H}}} , the gas mass (red line) in a galaxy will increase at a faster rate than the integrated CO luminosity (blue line). While higher levels of star-formation are correlated with both an increase in H 2 \text{H}_{2} and CO abundances, the decreasing temperatures that result from molecular gas shielding in dense star-forming regions lowers the rate at which the CO luminosity ( L CO ′ L^{\prime}_{\text{CO}} ) will increase with respect to the gas mass ( M gas M_{\text{gas}} ).
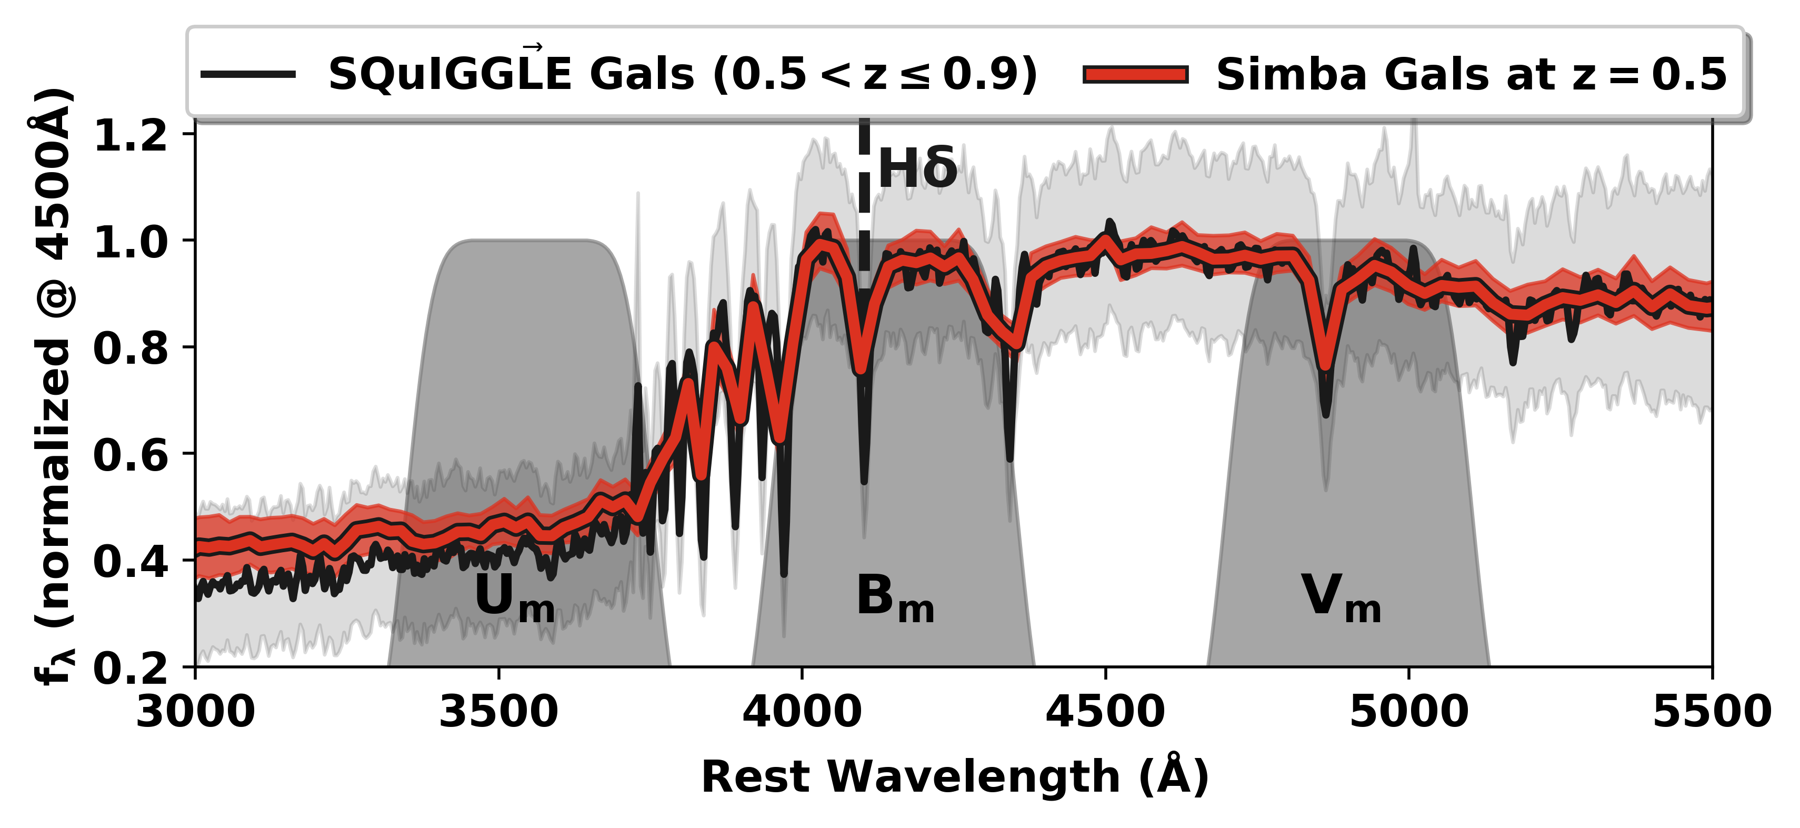
Tests the observational fidelity of Simba’s UBV-selected analogue by stacking its z=0.5 SEDs against roughly 1,300 SQuIGGℒE galaxies at z=0.5–0.9; the caption reports redder observed SEDs and a stronger Balmer break in SQuIGGℒE.
Original caption
Figure 15: In general, SQuiGG L → \bm{\vec{L}} E galaxies are redder than those UBV-selected (Eq. 5 ) galaxies from SIMBA . Spectral energy distributions (SEDs) for the two samples, stacked using the median, normalized at 4500Å, and surrounded by a shaded region indicating the 16th-84th percentile ranges are shown above. The black line shows the result of ∼ \sim 1,300 stacked SQuiGG L → \vec{L} E galaxies from z = 0.5 − 0.9 z=0.5-0.9 , while the red line shows the combined stack of 72 UBV-selected simba galaxies at z = 0.5 z=0.5 . Additionally, we show as gray shaded regions the synthetic rest-frame U m U_{m} , B m B_{m} , and V m V_{m} filters used to calculate the quantities shown in the left-panel of Fig. 14 . Finally, we indicate the location of the Balmer H δ \delta absorption line via a dashed vertical black line at λ = 4101.734 \lambda=4101.734 Å. We see here that in comparison to SQuiGG L → \vec{L} E galaxies, the UBV-selected systems in simba show a weaker Balmer break and stronger UV emission, suggesting that their stellar populations are more strongly influenced by recent star formation and therefore contain a larger fraction of young, hot, and massive stars.
Related research
Previous digest
Using the Simba cosmological simulation, Savitch et al. test why recently quenched massive galaxies can appear to retain large molecular-gas reservoirs, following galaxies with M* > 3×10^9 M⊙ from z=0–2. They find that three effects can each contribute: dust-obscured star formation can make gas-rich systems look optically quiescent, adopting a Milky Way CO-to-H2 conversion factor can overestimate H2 masses by about a factor of five in non-star-forming galaxies, and a smaller subset of gas-rich transitioning systems undergo temporary quiescence before rejuvenating on 100 Myr–2 Gyr timescales. The result reframes molecular gas-rich post-starburst candidates as a heterogeneous population rather than direct evidence that quenching universally leaves a long-lived, inert H2 reservoir.
Sources and evidence (26)
- 2610.06680v1: Unveiling the Origins of the Molecular Gas Reservoirs in Recently Quenched Massive Galaxies
Observations of quenched galaxies across cosmic time have revealed systems containing substantial molecular gas reservoirs, challenging the traditional picture of gas-poor, red and dead galaxies. Using the Simba cosmological simulation, we investigate three possible hypotheses for the origin of molecular gas-rich quenched systems: (i) quiescence is temporary and the galaxy will rejuvenate, (ii) molecular gas masses are overestimated due to an underestimated CO-to-H$_2$ conversion factor, or (iii) star formation is ongoing but heavily obscured by dust. Across $M_*>3\times10^9M_\odot$ galaxies from $z=0-2$, we find that all three mechanisms are plausible. Many seemingly quiescent, molecular gas-rich galaxies host dust-obscured star formation, with visual optical depths increasing on average from $τ_V\sim0.5-2.3$ from $z=0-2$. Assuming a Milky Way-like CO-to-H$_2$ conversion factor can overestimate molecular gas masses by a factor of $\sim\!5$ in non-star-forming galaxies, compared to $\sim\!1.45$ in star-forming galaxies. Temporary quiescence can also occur in gas-rich transitioning galaxies on timescales ranging from $100\,\text{Myr}-2\,\text{Gyr}$, although this is most prominent at high redshift and is relatively rare overall. Further work is needed to disentangle the relative contributions of these mechanisms across cosmic time.
- 2610.06680v1: Unveiling the Origins of the Molecular Gas Reservoirs in Recently Quenched Massive Galaxies
Among our initial sample of M ∗ > 3 × 10 9 M ⊙ M_{*}>3\times 10^{9}M_{\odot} galaxies, we find that at z = 0 z=0 that 249 (63%) are “star-forming”, 54 (14%) are “transitioning”, and 92 (23%) are fully “quenched”. This is consistent with the numerical results from [ 34 ] , which used rest-frame UVJ photometric colors to identify star-forming galaxies in the IllustrisTNG simulations, predicting that 71% of M ∗ > 10 9 M ⊙ M_{*}>10^{9}M_{\odot} galaxies will be star-forming. Moving to higher redshift, we find that at z = 1 z=1 the number of “star-forming”/“transitioning”/“quenched” galaxies decreases to 213/7/25 (87%/3%/10%), at z = 2 z=2 this becomes 99/6/5 (90%/5%/5%), and at z = 3 z=3 we find 59/0/1 (98%/0%/2%). While the lack of high-mass galaxies at high- z z is what causes the numbers to decrease so rapidly, we find in contrast that the fraction of star-forming galaxies increases with redshift. This is consistent with a number of observational studies, such as [ 124 ] , who studied galaxies from z = 7.5 → 2 z=7.5\to 2 from the COSMOS2020 observational catalog using their rest-frame near-ultraviolet (NUV), r, and j band colors, and found that at z ≥ 2 z\geq 2 , around 90 % 90\% of galaxies will be star-forming.
- 2610.06680v1: Unveiling the Origins of the Molecular Gas Reservoirs in Recently Quenched Massive Galaxies
Applying this photometric cut to our initial sample of M ∗ > 3 × 10 9 M ⊙ M_{*}>3\times 10^{9}M_{\odot} galaxies results in a sample of 21 (5.3%) UBV-selected galaxies at z = 0 z=0 . In agreement with the findings from [ 9 ] that PSB galaxies are most common at Cosmic Noon, we find that the highest fraction of UBV-selected galaxies in our sample occurs at z = 2 z=2 , dropping off both at higher and lower redshifts than this. Specifically, at z = 1 z=1 we find 48 galaxies (20%) in our sample are UBV-selected, at z = 2 z=2 we find 30 (27%), while at z = 3 z=3 this rapidly drops to only 10 galaxies (17%) which satisfy our UBV-selection.
- 2610.06680v1: Unveiling the Origins of the Molecular Gas Reservoirs in Recently Quenched Massive Galaxies
To investigate the relationship between the resulting α CO \alpha_{\text{CO}} of a galaxy and its level of star-formation, we show both quantities on a logarithmic scale for all z = 0 , 1 z=0,1 massive ( M ∗ > 3 × 10 9 M ⊙ M_{*}>3\times 10^{9}M_{\odot} ) galaxies in Fig. 6 . Here, the top panel shows α CO \alpha_{\text{CO}} on the y y -axis and sSFR × t H \text{sSFR}\times\text{t}_{\text{H}} on the x x -axis, while the bottom panel on the y y -axis instead shows the numerator/denominator of α CO \alpha_{\text{CO}} in red/blue. As in the last section, the background shading corresponds to our star-forming classification scheme from Eq. II.3.1 , so that the blue background corresponds to galaxies that are star-forming (Eq. 2 ), yellow for transitioning (Eq. 3 ), and red for quenched (Eq. 4 ). In both panels, we fit a linear regression to the data and show the resulting relationship as a solid line, surrounded by a 95% confidence interval (estimated using bootstrap resampling). From the top panel in Fig. 6 , we see that as a galaxies level of star-formation increases (quantified by sSFR × t H \text{sSFR}\times\text{t}_{\text{H}} ; c.f. § II.3.1 ), as does its value of α CO \alpha_{\text{CO}} . Furthermore, we see that all quenched, transitioning, and weakly star-forming galaxies will tend to have a value of α CO \alpha_{\text{CO}} less than α CO,MW \alpha_{\text{CO,MW}} , implying that the assumption that α CO = α CO,MW \alpha_{\text{CO}}=\alpha_{\text{CO,MW}} in most recently quenched massive galaxies will cause an overestimated value of M H 2 M_{\text{H}_{2}} . In fact, the linear regression shows that α CO > α CO,MW \alpha_{\text{CO}}>\alpha_{\text{CO,MW}} only for galaxies with sSFR × t H > 5 \text{sSFR}\times\text{t}_{\text{H}}>5 .
- 2610.06680v1: Unveiling the Origins of the Molecular Gas Reservoirs in Recently Quenched Massive Galaxies
Using these selection criteria, [ 21 ] found that among their star-forming galaxies, around 2.2% at z = 0.7 , 1.0 z=0.7,1.0 would be classified as ‘imposter PSBs’, thus instead represent star-forming systems misclassified as PSBs due to their photometry, and will contain substantial molecular gas reservoirs with depletion times of 600 Myr – 1.2 Gyr. In contrast, those identified as ‘true PSBs’ (quenched and UBV selected) will be gas-poor, and will exhibit the longest depletion times. This is in line with our findings, in which among our UBV-selected systems (Eq. 5 ) at z = 0.5 z=0.5 , those that are also star-forming (Eq. 2 ) will have median gas depletion timescales of 798 Myr, while those that are also quenched (Eq. 4 ) will have significantly longer depletion timescales, with a median of ∼ 2 \sim 2 Gyr. Similarly, [ 32 ] found that the average PSB in eagle loses ∼ 90 % \sim 90\% of its star-forming ISM within ∼ \sim 600 Myr following the starburst.
- 2610.06680v1: Unveiling the Origins of the Molecular Gas Reservoirs in Recently Quenched Massive Galaxies
[ 21 ] showed that typical PSBs, despite representing only 3.1% of M ∗ > 3 × 10 9 M ⊙ M_{*}>3\times 10^{9}M_{\odot} galaxies at z = 0.5 , 1 z=0.5,1 , tend to have molecular gas contents similar to star-forming galaxies of similar mass. Of these, only ∼ \sim 32% are classified as ‘true PSBs’. Such systems are found to be significantly gas-poor, with typical gas reservoirs likely below the detection limits of current observational facilities, making these systems virtually undetectable. Thus, since a majority of PSBs in eagle retain significant molecular gas reservoirs [ 32 ] , it would follow that such systems may instead constitute a sample of ‘imposter PSBs’, who have recently experienced a wave of feedback which has temporarily reduced their star forming efficiency. This is in line with their findings that such PSBs contain highly disturbed gas, with only a small fraction of kinetic energy in ordered rotation [ 32 ] .
- 2610.06680v1: Unveiling the Origins of the Molecular Gas Reservoirs in Recently Quenched Massive Galaxies
Hypothesis A: Temporary Quiescence (§ III.1 ) . Rejuvenation among massive galaxies is most common for molecular gas-rich galaxies ( ∼ 90 % \sim 90\% have M H 2 / M ∗ > 5 % M_{\text{H}_{2}}/M_{*}>5\% ) that have not yet fully quenched ( ∼ 80 % \sim 80\% are transitioning; Fig. 4 ). It is typically triggered by gas-rich mergers (Fig. 5 ), and is therefore most important at high redshift, becoming increasingly rare toward z = 0 z=0 (Fig. 3 ).
- 2610.06680v1: Unveiling the Origins of the Molecular Gas Reservoirs in Recently Quenched Massive Galaxies
In summary, using our sSFR-based method of identifying ‘low star forming’ galaxies produces a sample of galaxies with higher molecular gas masses then the analogous sample selected using Δ \Delta SFMS. Thus, since the focus of our paper is on those ‘low star forming’ galaxies that are also molecular gas-rich, we stick with the sSFR-based method. Additionally, doing so avoids the need to iteratively fit the SFMS at every snapshot we investigate.
- 2610.06680v1: Unveiling the Origins of the Molecular Gas Reservoirs in Recently Quenched Massive Galaxies
Now to compare their resulting sample against our analogous sample of UBV-selected galaxies (used in § III.3 ), we again show the top panel of Fig. 2 , but now add to the plot the analogous galaxy sample used by Suess et al. 109 (black dots). Upon examining Fig. 14 , we see many differences between the two samples. First, we see that the SQuiGG L → \vec{L} E galaxies (black points) have much higher/redder values of U m − B m U_{m}-B_{m} , which implies that SQuiGG L → \vec{L} E galaxies have a larger Balmer break and weaker UV emission than those UBV-selected systems in simba (red points). Specifically, U m − B m U_{m}-B_{m} quantifies the contribution of young stars to the total light, so is a sensitive probe of recent star formation, which further implies that the SQuiGG L → \vec{L} E galaxies are also more burst dominated than those in simba . As a result, we see also on the right-panel of Fig. 14 that the fact that simba galaxies (red points) are more dominated by recent star formation causes them to have significantly lower values of Lick H δ A \delta_{A} than the SQuiGG L → \vec{L} E galaxies (black points).
- 2610.06680v1: Unveiling the Origins of the Molecular Gas Reservoirs in Recently Quenched Massive Galaxies
In Appendix B.1 we describe in detail how we calculated the SFMS for simba , how it is traditionally used to categorize star-forming galaxies, and how this definition differs from the sSFR × t H \times\text{t}_{\text{H}} definition we used in this study. In summary, given these differences, we choose to avoid using a SFMS-based definition for quenching, partly because the redshift evolution of the SFMS differs between simulations and observations [ 14 ] , and also as shown in Appendix B.1 , our sSFR-based method of identifying ‘low star-forming’ systems produces a population of systems much more gas-rich than if we used the SFMS method. Therefore, we adopt our sSFR-based definition of quenching, given in Eq. 2 - 4 , as it is non-dimensional, invariant across redshift, and yields a more gas-rich sample.
- 2503.11611v1: A Census of the Most Obscured Galaxy Nuclei over Cosmic Time to be revealed by PRIMA
We have demonstrated the power of PRIMA to detect and characterize the deeply obscured galaxy nuclei over cosmic time. The main strength of PRIMA is the large sample of galaxies that can be observed in the resframe mid-IR up to z = 7 z=7 . We showed that with PRIMAger, the good wavelength coverage and sensitivity allows the successful detection of deeply obscured nuclei between z = 2 − 7 z=2-7 , where ∼ \sim 65 % \% of obscured nuclei can be recovered. Those recovered have the deepest silicate feature, while the remaining ∼ \sim 35 % \% are likely to suffer from contamination by the host galaxy. With different assumptions on the intrinsic fraction of sources hosting deeply obscured nuclei, we have shown that PRIMA can effectively constrain this number down to ∼ 10 % \sim 10\% of HLIRGs at z ∼ 7 z\sim 7 .
- 2503.11611v1: A Census of the Most Obscured Galaxy Nuclei over Cosmic Time to be revealed by PRIMA
To simulate the spectra, we scale the Spitzer spectra to match the photometry of objects in the SPRITZ simulation that are identified as deeply obscured nuclei (see Section 3.1.1 ). We show the resulting simulated spectra of an obscured nucleus at z = 5 z=5 , in Fig. 2 . We find that the continuum and emission/absorption features are present, allowing the recovery of PAH fluxes, ionic line fluxes such as [Ne II], and absorption from H 2 O ice at restframe ∼ 6 μ \sim 6\mu m. The spectra is therefore of a sufficiently high quality to characterize the nature of deeply obscured nuclei candidates identified from the imaging surveys.
- 2503.00998v1: Tentative detection of neutral gas in a Little Red Dot at $z=4.46$
We fit the spectrum with a Gaussian line profile using the emcee Python package. The right panel of Figure 2 shows the resulting posterior estimates of the line luminosity, width, and velocity offset from the nominal redshift of z = 4.4655 z=4.4655 . We measure a total line flux of I [ C i ] = 36.9 − 8.4 + 10.6 I_{[{\rm C}\,\textsc{i}]}=36.9_{-8.4}^{+10.6} mJy km s -1 and a luminosity of L [ C i ] = 1.0 − 0.2 + 0.3 × 10 7 L ⊙ L_{[{\rm C}\,\textsc{i}]}=1.0^{+0.3}_{-0.2}\times 10^{7}\,L_{\odot} . The line center is offset 19 − 14 + 9 19^{+9}_{-14} km s -1 from the nominal redshift, consistent with 0, and we derive a line FWHM of 80 − 22 + 38 80^{+38}_{-22} km s -1 . The line width is remarkably narrow, and in fact is unresolved; the velocity resolution for the ALMA observations is ∼ 70 \sim 70 km s -1 . The narrow line width implies a remarkably low dynamical mass, which we return to in § III.5 .
- 2503.00998v1: Tentative detection of neutral gas in a Little Red Dot at $z=4.46$
A key result from JWST is the discovery of an abundant population broad line AGN at z > 4 z>4 [ 29 , 69 ] . Among these are the “Little Red Dots” (LRDs), first identified as broad-line H α \alpha emitters in NIRCam/WFSS data [ 56 ] . The LRDs are characterized by a unique SED shape: blue in the rest-UV, but with a sharp turnover to a very red optical slope, suggesting significant dust attenuation [ 47 ] . They appear contribute significantly to the overall AGN population, and bolometric luminosity function, at z ∼ 4 z\sim 4 – 9 9 [ 28 , 45 , 44 , 2 ] . While generally fainter than the UV-bright quasars, their black hole masses and bolometric luminosities can approach the regime of low-luminosity quasars ( L bol ≳ 10 45 L_{\rm bol}\gtrsim 10^{45} erg s -1 ), despite their apparently high abundance.
- 2601.08212v1: Diverse Origins of Broad H$α$ Lines in Heavily Obscured AGNs Revealed by Multi-epoch Spectroscopy
To investigate this effect on Mrk 268, we calculated the SF data from the ZTF light curve after subtracting the host component assuming its contribution of 50% of the minimum flux of the original light curve data. As a result, while the derived SF values increase, it does not show a clear dependence on time separation as in the original SF data. This result indicates that even when considering host contamination, the ZTF light curve of Mrk 268 does not show a significant flux variation due to the AGN.
- 2601.08212v1: Diverse Origins of Broad H$α$ Lines in Heavily Obscured AGNs Revealed by Multi-epoch Spectroscopy
As a result, we obtained the intrinsic broad H α \alpha luminosity of MCG -3-34-64 as log ( L bH α , int . / erg s − 1 ) = 41.82 \log(L_{\mathrm{bH\alpha,int.}}\mathrm{/erg\ s^{-1}})=41.82 with a typical uncertainty of 0.4 dex [ 171 ] . As a result, L bH α , obs . L_{\mathrm{bH\alpha,obs.}} is consistent with L bH α , int . L_{\mathrm{bH\alpha,int.}} within the uncertainty. In other words, the ratio of L bH α , obs . L_{\mathrm{bH\alpha,obs.}} to L bH α , int . L_{\mathrm{bH\alpha,int.}} of MCG -3-34-64 is significantly larger than predicted from the scattering model. We note that, while we do not account for stellar absorption of the H α \alpha line in our spectral fitting, its effect is thought to be negligible because the typical equivalent width (EW) of stellar absorption [ 127 , 25 , E W ∼ EW\sim a few Å, e.g.] is much smaller than that of the fitted broad H α \alpha component of MCG -3-34-64 ( E W ∼ 300 EW\sim 300 Å).
- 2607.06844v1: First detection of ultra-fast outflows in a quiescent galaxy
Section 2 describes the reduction of data utilized in this work. In Section 3 and 4 , we show our spectral analysis of X-ray and other multi-wavelength data, respectively. The physical properties of outflows are derived in Section 5 . We discuss the implications in Section 6 and show conclusions in Section 7 . In this paper, we assume the cosmological constants at H 0 = 70 H_{\mathrm{0}}=70 km/s/Mpc, Ω Λ = 0.73 \Omega_{\mathrm{\Lambda}}=0.73 and Ω M = 0.27 \Omega_{\mathrm{M}}=0.27 .
- 2607.06844v1: First detection of ultra-fast outflows in a quiescent galaxy
A strong Fe-K α \alpha emission line ( ∼ 6.4 \sim 6.4 keV) and a tentative absorption feature ( ∼ 7 \sim 7 keV) appear in the residual spectra of both EPIC and NuSTAR data (panel b b of Fig. 2 ). We applied two line search methods to estimate the significance of these lines with results shown in Fig. 7 (see details in Appendix. A ). The Fe K α \alpha line is significantly detected at > 3.9 σ >3.9\sigma in both methods, with its significance peaking for a narrow core ( σ ≤ 1000 \sigma\leq 1000 km/s). An absorption feature is located at 7.25 − 0.07 + 0.07 7.25^{+0.07}_{-0.07} keV in the rest frame with a significance of ∼ 5 σ \sim 5\sigma and ∼ 3 σ \sim 3\sigma in single-trial and true significance (including the look-elsewhere effect) spectra, respectively. Its energy excludes the possibility of the Fe-K edge from ISM absorption ( Rogantini et al., 2018 , 7.11 – 7.13 7.11\mbox{--}7.13 keV,) , which implies a UFO with a velocity of v > 0.04 c v>0.04c assuming its origin is from Fe XXV/XXVI.
- 2507.00129v1: Lya2pcf: an efficient pipeline to estimate two- and three-point correlation functions of the Lyman-$α$ forest
However, in terms of computational costs, Lya2pcf and PICCA perform differently. As shown in Table 2 , PICCA takes longer to calculate two-point correlations when both codes are run under the same CPU architecture, with Lya2pcf taking 65% of the PICCA running time. Furthermore, the GPUs ability to make highly parallel computations fits particularly well for the problem at hand, making Lya2pcf faster on GPUs than on CPUs, especially for higher work loads such as with the DESI year five catalogs. This great improvement is better appreciated when calculating the distortion matrix. For example, Table 2 shows only a small improvement for the two-point correlation function when using CPUs or GPUs, where the overhead time needed to upload the δ \delta ’s information to the GPU compensates the gain in computation speed. The total computation time of the distortion matrix using the GPU shows a considerable gain, which can be appreciated from the quotient of times taken by the 2PCF and distortion matrix (DM) computations using PICCA under CPUs ( t D M / t 2 P C F = 5.54 t_{DM}/t_{2PCF}=5.54 ) or Lya2pcf under GPUs ( t D M / t 2 P C F = 3.2 t_{DM}/t_{2PCF}=3.2 ).
- 2507.00129v1: Lya2pcf: an efficient pipeline to estimate two- and three-point correlation functions of the Lyman-$α$ forest
One of the main reasons to write Lya2pcf is to be able to compute the 3PCF. Although previous analyses of the three point statistics in the Lyman- α \alpha exist in the literature, they mostly have been devoted to the one dimensional bispectrum [ 24 , 22 , 30 ] . For the 3PCF in real space, among the relevant work is that of [ 25 ] , where it was predicted the isotropic 3PCF signal for particular triangle configurations using synthetic data, with the aim of understanding UV background fluctuations. The authors suggest a signal-to-noise (S/N) of around 9 for the eBOSS sample. The goal in this work is complementary to [ 25 ] , providing the first measurement of the full anisotropic 3PCF over observational Lyman- α \alpha forests. Measuring this 3PCF signal is the first step towards using the 3PCF estimator ( 8 ) to constrain cosmology and the properties of the IGM. As it can seen in Figure 5 , we have promising results in the DR16 data sample, where we show the anisotropic 3PCF signal and its dispersion using subsamples of the data. All triangle configurations are shown, with their five parameters accommodated in a single (triangle) index. The S/N of around 22.5% (1.2%) of the binned configurations is above one (three), where the small-scale isosceles triangles are particularly dominant. Notice that the anisotropic signal has less restrictive power than the isotropic case, hence its smaller S/N than the predicted value of 9 of [ 25 ] . Actually, while averaging over both θ i \theta_{i} angles would result in the isotropic signal, its dispersion, re-scaled by the appropriate power of the number of bins, would imply a S/N ∼ 9 \sim 9 for triangles where both sides are under 20 Mpc/h.
- 2608.23498v1: The Road to Normalcy: Environment-Driven Evolutionary Pathways for Primordial Black Holes
Based on the initial conditions and numerical setup described above, we now present the simulation results and discuss their physical implications. To highlight the environmental dependence of PBH-seeded evolution, we organize this section around four connected aspects. We first examine how the large-scale environment drives distinct BH–host evolutionary pathways in Section III.1 . Building on these trends, we identify the main evolutionary phases and possible transitions toward normal galaxy–AGN configurations in Section III.2 . We then connect these regimes to stellar growth and metal enrichment in Section III.3 before translating the resulting evolutionary stages into observable signatures for current and future surveys in Section III.4 .
- 2608.23498v1: The Road to Normalcy: Environment-Driven Evolutionary Pathways for Primordial Black Holes
The results of Section III.1 show that the cosmological environment regulates the gas supply and co-evolution of PBH-hosting systems. We now examine how the initial PBH mass and its placement within the assembling overdense region modify this evolution. Here, “normalcy” is defined in an evolutionary, trend-driven sense. It does not require exact agreement with the local BH–galaxy scaling relations. Instead, it refers to a progressive reduction in the relative dominance of the initial seed, such that stellar and halo growth outpace BH growth and drive both M ∙ / M ⋆ M_{\bullet}/M_{\star} and M ∙ / M h , PBH M_{\bullet}/M_{\rm h,PBH} toward the ranges occupied by more conventional high-redshift galaxy–AGN systems.
- 2606.20800v1: No hidden monsters: Probing recently-quenched galaxies for obscured AGN with JWST-PRIMER MIRI and NIRCam
The primary result from this work shows that the vast majority of high-mass PSBs ( > 10 10 M ⊙ >10^{10}\textrm{\;M}_{\odot} ) show no excess MIR emission, indicating a lack of both obscured AGN and obscured star-formation. This implies that not only are their central SMBHs not continuously active throughout the entirety of the PSB phase, but moreover, highly accreting MIR AGN activity is fundamentally rare in massive PSBs. This is consistent with the results from X-ray detections ( French et al., 2023 ; Almaini et al., 2025 , e.g.) and radio detections ( Luo et al., 2026 ; Patil et al., 2026 , e.g.) , however, it is now possible to eliminate the caveat that the lack of X-ray detections in PSBs could be due to them being heavily obscured as a population. Our results also allow us to constrain the strength of the MIR light that is present in PSBs, showing that as a population, their SMBHs are at accreting at < 1 % <1\% Eddington.
- 2606.20800v1: No hidden monsters: Probing recently-quenched galaxies for obscured AGN with JWST-PRIMER MIRI and NIRCam
While these results allow for the possibility that high-mass PSBs are continuously in maintenance-mode ( < 1 % <1\% Eddington) over their ∼ \sim 1 Gyr visibility time, it is also possible that their AGN have short duty cycles, instead emitting in brief, stochastic, quasar mode ( > 1 % >1\% Eddington) bursts rather than over a single monolithic period. Indeed, in our sample we find there are two massive PSBs that are elevated in both MIR colours (with both of these galaxies in the 1 < z < 1.5 1<z<1.5 bin). Visual inspection of these objects shows that one of them is part of a complex, multi-galaxy merger, and thus likely has contaminated MIRI flux values, therefore we remove it from our analysis. The other elevated PSB is an isolated source with no immediate companions, with an upturn in both the MIR and the optical regime. Its F200W residual after the removal of a PSF convolved single Sérsic model shows some extended structure which could be an indication of merger remnants, however, it is not significant enough to influence any definitive conclusions. This does mean however, that ∼ 3 % \sim 3\% ( 1 / 33 1/33 ) of our massive PSB sample have elevated MIR emission consistent with obscured AGN, which follows well with the equivalent 3 % 3\% found in both Meusinger et al. (2017) and Smercina et al. (2018) (both using low- z WISE observations).
- 2505.05556v1: Super-Eddington accretion in high-redshift quasar hosts: Black-hole driven outflows, galaxy quenching, and the nature of little red dots
These results allow us to improve the comparison with observed outflows. In particular, we first rescale the observed estimates to the MBH masses and luminosities of our source ( M BH ∼ 5 × 10 7 M ⊙ M_{\rm BH}\sim 5\times 10^{7}\rm\,M_{\odot} and L BH ∼ 10 45 erg s − 1 L_{\rm BH}\sim 10^{45}\rm\,erg\,s^{-1} ), using the scaling relations obtained for molecular and ionised winds in the local Universe ( OPEN 0.1 ≲ z ≲ 3 ) 0.1\lesssim z\lesssim 3) by Fiore et al. (2017) . In the low-redshift sample, molecular outflow rates are of the order of hundreds of M ⊙ yr − 1 \rm M_{\odot}\ yr^{-1} , measured at distances between 0.1 and 3 kpc from the galactic centre. Compared to observations, our mass outflow rate is still approximately one order of magnitude lower. However, it is important to highlight that the observed molecular outflows at low-redshift are typically detected in the very central regions of galaxies, while in our case, at a distance of 2 kpc, we are already probing the CGM, outside the simulated galaxy. Additionally, our simulations have certain limitations: first, we may not have a high enough resolution to resolve the formation of molecular gas within outflows ( Richings & Faucher-Giguère, 2018b ) . Secondly, by already being outside the galaxy, the gas can mix with the hot gas in the halo, and is also exposed to the dissociating UV background, which may prevent molecule formation altogether. As for ionized winds instead, the radii at which they are typically observed range from sub-kpc scales up to tens of kpc, which are comparable to the distances probed in our simulation. In this case, our results are more consistent with the observations: for a galaxy with the same bolometric luminosity as in our simulation, we find comparable mass outflow rates of the order of 1 − 100 M ⊙ yr − 1 1-100\ \rm M_{\odot}\ yr^{-1} , except around the time of the feedback-driven cavity formation, where we expect enhanced outflow activity.
- 2505.05556v1: Super-Eddington accretion in high-redshift quasar hosts: Black-hole driven outflows, galaxy quenching, and the nature of little red dots
While the intrinsic properties of simulated galaxies give us important information about the physical modelling, they do not directly allow us to compare results with observations. For this reason, we consider here how MBH accretion and the related AGN feedback shapes the host galaxy emission, by analysing the spectral evolution and observational features associated to the simulated galaxy during and after the sustained phase of super-Eddington growth discussed in the previous Section. We use the open-source Synthesizer package ( Vijayan et al., 2020 ; Wilkins et al., 2020 ) 2 2 2 https://synthesizer-project.github.io/synthesizer/ , which allows to generate realistic galaxy observables and mock spectra from cosmological simulations. The emerging spectrum of the galaxy stellar component is computed based on the stellar particle mass, age and metallicity, taking into account nebular emission, photoionisation reprocessing and dust attenuation. 3 3 3 We assume intrinsic stellar emission from the BPASS stellar population synthesis code ( Byrne et al., 2022 ) , including binary stars and adopting a Chabrier initial mass function ( Chabrier, 2003 ) extending between M ⋆ = 0.3 − 100 M ⊙ M_{\star}=0.3-100\,\mathrm{M}_{\odot} . We assumed here a Calzetti attenuation law ( Calzetti et al., 2000 ) , and self-consistently derived the dust attenuation from the gas distribution and metallicity provided by the simulation within 1 kpc from the galaxy centre. The AGN spectrum instead is consistently modelled starting from a multi-component accretion disc continuum ( Mathews & Ferland, 1987 ) , and includes the reprocessed emission form the broad line region (BLR), narrow line region (NLR) and dusty torus, assuming dust attenuation following A λ ∝ λ − 2 A_{\lambda}\propto\lambda^{-2} .
Abstract
Observations of quenched galaxies across cosmic time have revealed systems containing substantial molecular gas reservoirs, challenging the traditional picture of gas-poor, red and dead galaxies. Using the Simba cosmological simulation, we investigate three possible hypotheses for the origin of molecular gas-rich quenched systems: (i) quiescence is temporary and the galaxy will rejuvenate, (ii) molecular gas masses are overestimated due to an underestimated CO-to-H$_2$ conversion factor, or (iii) star formation is ongoing but heavily obscured by dust. Across $M_*>3\times10^9M_\odot$ galaxies from $z=0-2$, we find that all three mechanisms are plausible. Many seemingly quiescent, molecular gas-rich galaxies host dust-obscured star formation, with visual optical depths increasing on average from $τ_V\sim0.5-2.3$ from $z=0-2$. Assuming a Milky Way-like CO-to-H$_2$ conversion factor can overestimate molecular gas masses by a factor of $\sim\!5$ in non-star-forming galaxies, compared to $\sim\!1.45$ in star-forming galaxies. Temporary quiescence can also occur in gas-rich transitioning galaxies on timescales ranging from $100\,\text{Myr}-2\,\text{Gyr}$, although this is most prominent at high redshift and is relatively rare overall. Further work is needed to disentangle the relative contributions of these mechanisms across cosmic time.
Discussion
Discussion access requires a security token. Register for the weekly digest.