2603.12200v1 · First listed 2026-03-12
GATOS N: The first direct kinematic evidence of dusty outflows from AGN via PAH kinematics of local Seyfert galaxies with JWST
JWST IFU observations of 10 local Seyferts use PCA tomography of broad PAH bands to map dust-phase kinematics. The authors report neutral, larger PAHs sharing molecular and ionised-outflow signatures in NGC 5728 and NGC 7582, while 3.3 μm PAHs trace disks. [1]
Evidence
The study combines JWST/NIRSpec IFU and MIRI/MRS spectroscopy for 10 local Seyferts. After isolating each feature and subtracting a locally fitted linear continuum, the authors apply PCA tomography to spatial–spectral cubes. The first component supplies a data-driven reference PAH profile; higher components, especially the second, encode wavelength shifts used for velocity maps. This is intended to address PAHs’ broad, intrinsically variable profiles, for which spaxel-by-spaxel fitting or simple cross-correlation is difficult. The analysis concentrates on relatively unblended 3.3, 11.3, and 17.0 μm PAHs; 7.7 μm is avoided because of line blending and continuum complexity. In NGC 5728 and NGC 7582, after model disk subtraction, 11.3 and 17 μm PAH velocity fields reportedly resemble high-ionisation [Ne VI] or [Ne V] outflow kinematics. The PAH velocities are also described as similar to H₂ rotational-line kinematics. [1][2][4][5][6]
Earlier work
The supplied text places the molecular-gas comparison in context: it says H₂ S(5) outflow contributions in NGC 5728 were presented by Davies et al. (2024), and that NGC 7582 was analysed by Veenema et al. (2025). The new comparison is therefore from established warm-H₂ outflow indications to PAH kinematics interpreted as a dust-phase tracer. However, the supplied extracts provide neither the earlier papers’ measurements nor their methods, so the strength of any quantitative agreement cannot be independently assessed here. [7][8][1]
What changes
Rather than inferring dust association from continuum morphology, the authors use resolved PAH velocity fields as the proposed kinematic dust diagnostic. They find contrasting band behaviour: the 3.3 μm PAH is reported to trace only the circumnuclear disk, whereas the 11.3 and 17 μm bands retain an outflow-like residual after disk subtraction. They interpret this pattern as consistent with outflow PAHs being predominantly neutral and relatively large; this is an interpretation, not a direct grain-size measurement. The 6.2 μm feature is not used as a robust kinematic tracer because PCA appears sensitive to changing intrinsic profiles between disk/star-forming and outflow regions. [1][5]
Limits and open questions
The result is feature- and target-dependent rather than a demonstrated property of all 10 Seyferts. Blank velocity-map panels can result from inadequate signal-to-noise. The 6.2 μm PAH cannot yield a straightforward kinematic comparison, and 7.7 μm is excluded owing to blending. For NGC 7582, asymmetric coverage and bright southeastern star-forming regions complicate H₂ interpretation; redshifted excess could indicate outflow but has also been attributed to projected inflow. Disk-model residuals can additionally be biased by off-centre fields of view, requiring fitted systemic-velocity shifts. No numerical PAH velocities, residual amplitudes, or statistical detection significances are supplied in the extracted text. [5][8][10]
Extraction is partial rather than abstract-only: it includes the abstract and selected method, velocity-map, molecular-gas, and disk-modelling passages. It does not include tables or full sample-by-sample numerical velocities, fit uncertainties, or detection significances; figure interpretations rely on the supplied captions.
Key figures
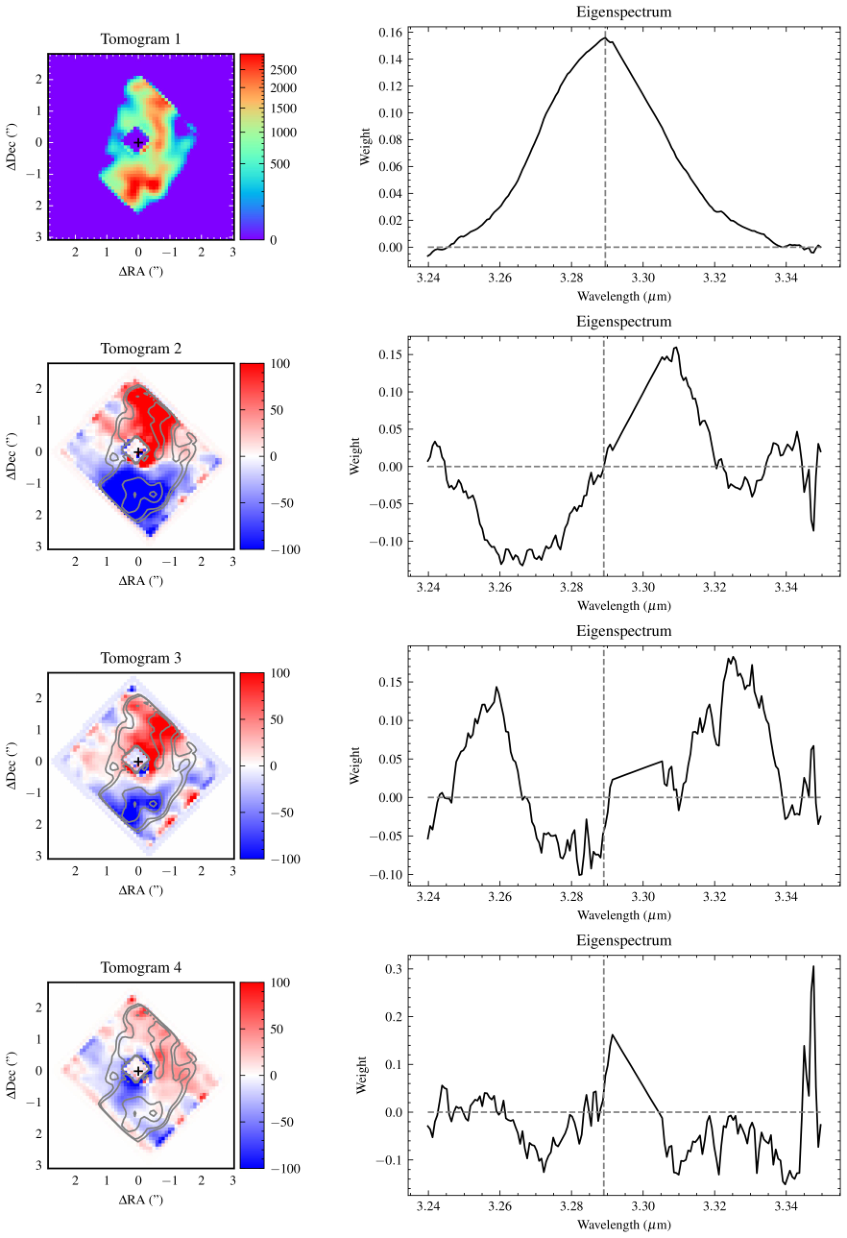
Tests the PCA premise for NGC 7582: the first component represents the rest-frame PAH emission, while a red/blue antisymmetric second component is the signature used to identify rotation. The caption cautions that tomogram colours are correlation strengths, not velocities.
Original caption
Figure 1: The first four principal components of the 3.3 μ \mu m PAH for NGC 7582. Each row shows each component, where the higher components contain progressively less information held within the original data cube. The left panels show the tomograms which show the spatial distribution of the eigenspectra in the right panels. The first component describes the rest frame emission of the feature while the second component shows a redshifted/blueshifted feature on either side of the nucleus, indicative of rotation. The higher order components contain extra information on the velocity field and/or variations in the intrinsic profile of the PAH feature. The contours overlaid on the tomograms show the first principal component. Note that the colour scale for each of the tomograms is not velocity but rather a correlation coefficient of how strongly each eigenspectrum maps onto the spatial dimensions. The vertical dashed grey lines show the wavelength where the second eigenspetrum crosses zero, showing the kinematic centre. Note that the smooth line between 3.29 - 3.30 μ \mu m that can be seen in the Eigenspectra is due to the masking of the Pf δ \delta line.

Tests phase-to-phase kinematic correspondence across the sample by placing ionised ([Ne VI]/[Ne V]), warm/hot molecular H₂, and three PAH velocity maps on matched fields of view and velocity scales; absent panels explicitly flag insufficient signal-to-noise.
Original caption
Figure 2: Velocity maps of each spectral feature for each galaxy. From left to right we show [NeVI] (7.65 μ \mu m), H 2 S(5) (6.91 μ \mu m), H 2 S(1) (17.03 μ \mu m), 3.3 μ \mu m PAH, 11.3 μ \mu m PAH and the 17 μ \mu m PAH. For each galaxy the field of view is the same for each map as well as the velocity scale. We show [NeV] (14.32 μ \mu m) for NGC 7582 as the [NeVI] (7.65 μ \mu m) has a lower signal to noise. The position angle of the major axis of the disk is shown with the solid line while the position angle of the major axis for the outflow is shown with the dashed line. Values are found in Table 1 . Panels that are blank lack the signal to noise to produce velocity maps.
Tests whether PAH motions remain aligned with the outflow after subtracting a disk constrained by CO and stellar kinematics in NGC 5728. It directly compares residual H₂ and 3.3/11.3 μm PAH maps with the ionised-outflow geometry.
Original caption
Figure 3: Disk modelling and subtraction for NGC 5728. The top left panel shows a three color image constructed from custom filters of MUSE cubes. Blue is a filter centred on [O III] (5028–5095 Å), green is H α \alpha (6578–6664 Å) and an i i band filter (6430–8630 Å) is shown in red. The white square shows the FOV of the other panels. The middle left panel shows the velocity map of [NeVI] tracing the outflow. The bottom left panel shows the disk model with fixed inclination and position angle constrained from CO and stellar kinematics ( Shimizu et al., 2019 ) . The right panels show the disk subtracted velocity maps for molecular gas (warm S(1) and hot S(5)) as well as the 3.3 μ \mu m PAH (small & \& neutral) and the 11.3 μ \mu m PAH (large & \& neutral). The major axis of the disk is shown with the solid grey line while the outflow cone is shown with the dashed lines in red and blue for the redshift and blueshift sides of the cone respectively.
Related research
Previous digest
This paper presents the first spatially resolved kinematic evidence for dust in the outflows of Active Galactic Nuclei (AGN). The main result is that the velocity of the PAHs is similar to the molecular gas as traced by the rotational transitions of H$_2$, where for NGC 5728 and NGC 7582, both disk and outflow are present.. So the paper's core point is that this suggests the PAHs in the outflow are more neutral and larger than in star-forming regions, consistent with PAH band ratios in previous studies of AGN.. One caveat to keep in mind is that this is however challenging due to their broad shapes and variations in their intrinsic profile, prompting the need for techniques such as PCA tomography..
Sources and evidence (23)
- 2603.12200v1: GATOS N: The first direct kinematic evidence of dusty outflows from AGN via PAH kinematics of local Seyfert galaxies with JWST
We present the first spatially resolved kinematic evidence for dust in the outflows of Active Galactic Nuclei (AGN). We utilise observations from JWST with NIRSpec IFU and MIRI MRS data of 10 local Seyferts and use Principal Component Analysis (PCA) tomography to extract the kinematics of Polycyclic Aromatic Hydrocarbon (PAH) features. PAHs comprise the smallest carbonaceous dust molecules in the Interstellar Medium (ISM), and produce emission features in the infrared providing the potential to measure kinematics. This is however challenging due to their broad shapes and variations in their intrinsic profile, prompting the need for techniques such as PCA tomography. We find that the velocity of the PAHs is similar to the molecular gas as traced by the rotational transitions of H$_2$, where for NGC 5728 and NGC 7582, both disk and outflow are present. We detect the outflow in the kinematics of large and neutral PAHs, namely the 11.3 $μ$m and 17 $μ$m PAH features, where after subtracting the disk, the velocity field matches that of high-ionisation potential lines such as [NeVI] (7.65 $μ$m, IP = 158 eV). Finally, we fail to detect kinematics of the 6.2 $μ$m PAH due to an altered intrinsic profile while the the 3.3 $μ$m PAH kinematics purely trace the circumnuclear disk. This suggests the PAHs in the outflow are more neutral and larger than in star-forming regions, consistent with PAH band ratios in previous studies of AGN.
- 2603.12200v1: GATOS N: The first direct kinematic evidence of dusty outflows from AGN via PAH kinematics of local Seyfert galaxies with JWST
Before applying the PCA decomposition, the cubes are prepared in the following way. First the spectral feature of interest is isolated in wavelength, creating a sub-cube. A local continuum is then fit assuming a simple straight line before it being subtracted. The resulting cube has the form 𝐈 x , y , λ \mathbf{I}_{x,y,\lambda} which is then collapsed into two dimensions where the spatial dimensions, x , y x,y are transformed by
- 2603.12200v1: GATOS N: The first direct kinematic evidence of dusty outflows from AGN via PAH kinematics of local Seyfert galaxies with JWST
resulting in a cube, 𝐈 β , λ \mathbf{I}_{\beta,\lambda} . The PCA is applied to this cube where
- 2603.12200v1: GATOS N: The first direct kinematic evidence of dusty outflows from AGN via PAH kinematics of local Seyfert galaxies with JWST
Donnan et al. (2024) demonstrated that this technique is effective in recovering the velocity field as compared to more traditional methods. The necessity to use PCA tomography to measure the velocity field of PAH features over more traditional methods such as fitting each spaxel, results from two major advantages it has over simple velocity cross-correlation. First, the PCA can detect shifts in the restframe feature, using all the information contained within the spatial dimensions, picking out the signature of kinematics. Secondly, there is not well defined a priori restframe profile for PAH features and so the first principal component provides a reference profile to be able to measure the velocity field.
- 2603.12200v1: GATOS N: The first direct kinematic evidence of dusty outflows from AGN via PAH kinematics of local Seyfert galaxies with JWST
We extract the kinematics of the PAH features, providing a probe of the dust phase and in particular small carbonaceous dust. We focus on the 3.3 μ \mu m, 11.3 μ \mu m and 17.0 μ \mu m (via the 16.4 μ \mu m sub-feature) features due to their relative lack of blending with other features. We note that the results using the 6.2 μ \mu m PAH feature do not easily compare with what we see from the other features. This might be because the 6.2 μ \mu m PAH feature arises from ionised PAHs which could be subject to destruction by the radiation field of the AGN ( García-Bernete et al., 2024 , e.g.) , leading to a relatively low signal to noise in outflow regions compared to other PAH features. The PCA appears to select different intrinsic profiles for the outflow regions compared to SF regions for the 6.2 μ \mu m feature. We therefore discuss the output of the PCA analysis of the 6.2 μ \mu m PAH in section 5.2 . We also avoid the 7.7 μ \mu m due to the blending with many emission lines such as [NeVI] (7.65 μ \mu m) and the complex continuum in this region of the mid-infrared. Therefore our analysis of the 3.3, 11.3 and 17.0 μ \mu m features are strongly dominated by the neutral PAHs.
- 2603.12200v1: GATOS N: The first direct kinematic evidence of dusty outflows from AGN via PAH kinematics of local Seyfert galaxies with JWST
As described in section 3 , velocity maps can be recovered from the principal components, where the first component contains the restframe emission while the higher order components and in particular the second component, contain the information about the velocity field. We show the resulting velocity maps for all the features described above in Fig. 2 .
- 2603.12200v1: GATOS N: The first direct kinematic evidence of dusty outflows from AGN via PAH kinematics of local Seyfert galaxies with JWST
The hot molecular gas is traced by the H 2 S(5) line while cooler molecular gas is traced by the H 2 S(1) line. The H 2 kinematics are typically dominated by rotation in the galaxy disk, however the S(5) line appears to show contribution from the outflow in ESO 137-G034, NGC 5728 and NGC 7582. This result was presented by Davies et al. (2024) for NGC 5728 while Veenema et al. (2025) presents analysis of NGC 7582.
- 2603.12200v1: GATOS N: The first direct kinematic evidence of dusty outflows from AGN via PAH kinematics of local Seyfert galaxies with JWST
The increase in the contribution of the outflow results in the position angle of the kinematic axis changing from the S(1) to the S(5) line. For NGC 7582, the picture is less clear for the H 2 lines. This is partly due to the asymmetric FOV of the hotter H 2 lines, making it difficult to fully observe the kinematics. Moreover, the flux of the H 2 lines is strongly dominated by two star-forming regions to the south east ( Veenema et al., 2025 ) , which also show excess blueshifted velocities in the molecular gas ( Veenema et al., 2025 ; García-Burillo et al., 2021 ) . However we do see some excess redshifted emission towards the north east consistent with the velocity map of [NeV] which may suggest a small outflow contribution in the H 2 lines for NGC 7582. This is investigated further in section 4.2 . Alternatively, García-Burillo et al. (2021) suggests that the redshifted excess may result from the projection of local inflowing gas considering they coincide with the passage of spiral arms along the minor axis.
- 2603.12200v1: GATOS N: The first direct kinematic evidence of dusty outflows from AGN via PAH kinematics of local Seyfert galaxies with JWST
Polycyclic Aromatic Hydrocarbons (PAHs) comprise the smallest carbonaceous dust molecules and consist of rings of carbon bonded with hydrogen. These molecules are radiatively excited by UV photons from young stars, where the subsequent de-excitation via the stretching and bending of C-C and C-H bonds results in a suite of broad emission features in the infrared (3-17 μ \mu m) ( Tielens, 2008 ; Li, 2020 , e.g.) . While graphite and silicate dust grains produce a continuum that is unsuitable to measuring kinematics, the emission profiles of PAH molecules provide the possibility of measuring kinematics, but their broad shapes provide significant challenges ( Donnan et al., 2024 ) .
- 2603.12200v1: GATOS N: The first direct kinematic evidence of dusty outflows from AGN via PAH kinematics of local Seyfert galaxies with JWST
This results in the disk models shown in Fig. 4 . Subtracting the disk model from the observed velocity map results in the right hand column of Fig. 4 . We additionally shift the systemic velocity of the H 2 S(5), H 2 S(1) and the 11.3 μ \mu m PAH, by adding the systemic velocity as a free parameter to the disk fitting, as the maps appear to be dominated by redshifted emission. This is likely a result of the field of view being off-centre, where the emission is therefore dominated by the blueshifted side of the disk. This leads to the first principal component appearing too blue and therefore the wavelengths shifts for each spaxel are redder resulting in a map offset to positive velocities.
- 2601.07990v1: Evidence of Feedback Effects in Low-luminosity Active Galactic Nuclei Revealed by JWST Spectroscopy
Figure 3: Diagnostic diagrams of ionized emission line ratios: (a) [Ne V ]/[Ne III ] versus [O IV ]/[Ne III ], and (b) [Ne V ]/[Fe II ] versus [O IV ]/[Fe II ]. The reddish and greenish contours show the distributions of model results computed by [ 165 ] for AGN and fast radiative shocks (including the shock precursor), respectively, with each contour enclosing 30%, 60%, and 90% of the model results from inside to outside. The colored and gray data points represent measurements for the nuclear regions of the four low-luminosity AGN studied here and the six higher-luminosity Seyferts studied by [ 164 ] , respectively. The line ratios of NGC 1266 are marked as upper limits because [Ne V ] and [O IV ] flux measurements of this galaxy are below three times of the standard deviation noise of local continuum.
- 2601.07990v1: Evidence of Feedback Effects in Low-luminosity Active Galactic Nuclei Revealed by JWST Spectroscopy
Figure 5 also shows that the warm H 2 gas, mostly traced by low-J pure-rotational transitions, in the nuclear regions of the four low-luminosity AGN does not reach particularly high temperatures. This result is consistent with a higher fraction of the H 2 gas distributed toward the lower-temperature end in these nuclear regions, as indicated by their higher power-law temperature distribution index β \beta ( ∼ 5.0 − 5.5 \sim 5.0-5.5 ; see Section B ), particularly when compared to the nuclear apertures of higher-luminosity Seyferts ( β ≈ 4.0 − 5.0 \beta\approx 4.0-5.0 ; Davies et al. 23 , Zhang et al. 163 , Delaney et al. 25 ). This result further implies that non-thermal heating contributes to the warm H 2 excitation in the nuclear regions of the four low-luminosity AGN. As discussed above, slow molecular shocks are the most likely source of this non-thermal heating, and neither UV heating in PDRs nor X-ray heating from XDRs can account for the observed H 2 emission strength. Cosmic rays could be another heating source for the warm H 2 ( Ferland et al. 38 , Ogle et al. 119 ). However, even only for the warm H 2 content in these nuclear regions ( ∼ 10 4.2 − 10 6.4 M ⊙ \sim 10^{4.2}-10^{6.4}\,{\rm M_{\odot}} ; see Appendix B ), reproducing the observed H 2 fluxes through cosmic-ray heating alone would require cosmic-ray excitation rates of order ∼ 10 − 11 s − 1 \sim 10^{-11}\,{\rm s^{-1}} , assuming an energy deposition of 20 eV per excitation event and ∼ \sim 5% of this energy ultimately going to H 2 rotational emission (i.e., L H 2 L_{\rm H_{2}} is of N H 2 × 20 eV × 0.05 × 10 − 11 s − 1 N_{\rm H_{2}}\times\rm 20\,eV\times 0.05\times 10^{-11}\,s^{-1} ). The implied cosmic-ray excitation rates are much higher than those expected for low-luminosity AGN ( ∼ 10 − 12 s − 1 \sim 10^{-12}\,{\rm s^{-1}} ; Koutsoumpou et al. 90 , Koutsoumpou et al. 91 ), indicating that cosmic-ray heating can only play a secondary role in powering the H 2 rotational emission in these nuclear regions.
- 2506.20896v1: Blowing star formation away in AGN Hosts (BAH) -- IV: Feeding and feedback in 3C 293 observed with JWST NIRSpec
We use JWST/NIRSpec observations of the radio galaxy 3C 293 to map the emission, extinction, and kinematics of hot molecular and ionized gas, as well as stellar kinematics, within the inner ~ 2 kpc. The stellar velocity field is well described by a rotating disk model, with its kinematical center offset by ~ 0.5 arcsec from the continuum peak. The hot molecular gas is traced by the H$_2$2.12$μ$m emission line, and the ionized gas by [Fe II]1.64$μ$m and Pa$α$. The gas presents three main kinematic components: a rotating disk seen as a narrow component ($σ$ ~ 100 kms$^{-1}$); a blueshifted broad outflow ($σ$ ~ 250 kms$^{-1}$); and a fast ionized outflow as a very broad component ($σ$ ~ 640 kms$^{-1}$). Extinction maps reveal high A$_V$ values, up to ~ 35, spatially coincident with dust lanes seen in optical images. In addition to the disk and outflows components, inflows along the dust lanes are detected in H$_2$ gas, with a mass inflow rate of $\dot{M}_{in}$ ~ 4 x 10$^{-4}$ M$_{\odot}$ yr$^{-1}$, which is lower than the AGN accretion rate. For the outflows, we derive peak mass-outflow rates of 0.08 $\pm$ 0.02 M$_{\odot}$yr$^{-1}$ (molecular) and 6.5 $\pm$ 1.7 M$_{\odot}$yr$^{-1}$ (ionized). The outflow, driven by the radio jet, has a kinetic power of 5.7% of the jet power - enough to suppress star formation. Our results highlight 3C 293's turbulent post-merger history and JWST's unique capability to probe dust-obscured AGN.
- 2601.15384v1: An Analysis of AGN Feedback in the Compact Galaxy Group Stephan's Quintet
Compact galaxy groups are ideal laboratories for studying the effects of interactions between AGN and multiple nearby galaxies. Recent JWST observations of the nearby compact group Stephan's Quintet highlight tidal flows between the interacting galaxies as well as outflows from the active galaxy NGC 7319. To study the kinematics on a large scale throughout the group, we obtained spatially-resolved long-slit spectra of Stephan's Quintet at multiple slit positions with Apache Point Observatory's Kitt Peak Ohio State Multi-Object Spectrograph. We fit multiple Gaussians to the H$α$ $λ$6563 Å and [N II] $λλ$6548, 6583 Å emission lines to isolate the different kinematic components. We used the kinematics to develop the first biconical outflow model of the narrow-line region of NGC 7319. Using a combination of galactic rotation models, biconical outflow models, and kinematic maps of the ionized gas, we disentangled the outflows, rotation, and tidal flows in the group. We found outflow radial velocities up to 550 km s$^{-1}$ peaking at 2.6 kpc from the central supermassive black hole, and a transition from AGN-powered outflows to gravitationally-powered tidal flows at a projected distance between 2.4 -- 6.3 kpc. We performed a line ratio analysis and determined the gas shows Seyfert-like ionization out to 6.3 kpc (projected), which supports our finding that gas outside this radius is predominantly powered by tidal flows. Our separation of kinematic components in Stephan's Quintet will enable future studies of the physical conditions and dynamical forces in the ionized gas to better quantify the feeding and feedback processes of AGN in compact groups.
- 2509.25483v1: Shocked, Heated, and Now Resolved: H$_2$ excitation in the low-luminosity AGN at M58 core with JWST
We present JWST NIRSpec and MIRI MRS observations of the central kiloparsec of M58 (NGC 4579), a nearby LINER galaxy hosting a low-luminosity AGN (LLAGN; $L_\mathrm{bol} \sim 10^{42}$ erg s$^{-1}$) with a low-power jet. These data provide an unprecedented view of the warm molecular gas phase and reveal clear signatures of feedback. We detect 44 H$_2$ lines, including bright pure rotational lines (S(1)-S(18)) and rovibrational lines up to $ν=2$, probing a wide range of excitation conditions. Excitation diagrams show that rotational lines follow a power-law temperature distribution with an exponential cutoff, consistent with heating by low-velocity shocks. H$_2$ rovibrational lines deviate from thermal models primarily because of sub-thermal excitation at low density. Additionally, there may be a 10% contribution powered by AGN X-ray photons in the nucleus. The dust lanes associated with the spiral inflow appear dynamically undisturbed but show signs of shock heating, while the inner $\sim$200 pc exhibits turbulent kinematics produced by outflowing molecular gas. These results reveal the subtle yet measurable impact of LLAGN feedback on the interstellar medium, demonstrating that even weak, vertically oriented jets and low radiative accretion rates can perturb molecular gas and regulate nuclear reservoirs. This study highlights JWST's transformative ability to uncover hidden modes of AGN feedback.
- 2601.02865v1: GATOS XI : Excess dust heating in the Narrow Line Regions of nearby AGN revealed with JWST/MIRI
Fig. 3 (left) shows the median SEDs across all ROIs and galaxies, separating dusty NLRs from star forming (SF) clumps. As shown in Section 3.1 , only four galaxies have resolved dust along the NLR (ESO 428 − - G14, NGC 4388, NGC 5728, NGC 3081). As a result, we restrict the NLR SEDs to these targets. Across all galaxies, we find a systematic difference between SEDs of dust in the NLR and those of SF clumps. On average, SF clumps are characterised by flatter and hotter SED distributions, while dusty NLRs produce SEDs that are steeper by a factor of two (e.g. F 18 μ m , NLR / F 10 μ m , NLR F_{18\,\rm\mu m,\,\rm NLR}/F_{10\,\rm\mu m,\,\rm NLR} = 4). While each ROI in each galaxy shows its own unique distribution, some common trends can still be identified across the sample. For example, SF clumps consistently produce higher 5.6 μ m \rm\mu m contributions (e.g. NGC 7172, NGC 3227, NGC 2992). This rise towards the shortest wavelengths may correspond to a low level of stellar light in the MIR. For dusty NLRs, a slight flux enhancement at 5.6 μ m \rm\mu m is likely due to this stellar component ( ≤ 10 % \leq 10\% ) (Rosario+ in prep) . In general, both NLR dust and SF clumps produce SEDs that peak at around at 18-21 μ m \rm\mu m . In SF clumps, a modest excess in the F1800W band over an otherwise flat SED shape could instead arise from Polycyclic Aromatic Hydrocarbon (PAH) emission ( García-Bernete et al., 2022 ) .
- 2601.02865v1: GATOS XI : Excess dust heating in the Narrow Line Regions of nearby AGN revealed with JWST/MIRI
In Haidar et al. (2024) , we discussed in detail how JWST/MIRI broadband imaging can be subject to contamination from strong emission lines, and as a result, these images may not be exclusively tracing dust emission. For example, the F1000W filter is mainly affected by contributions from the [ S iv ] λ 10.51 μ m \lambda 10.51\,\rm\mu m and H 2 H_{2} 0-0 S(2) [ 9.65 μ m 9.65\,\rm\mu m ] lines. This can make it challenging to determine the morphology and extent of the dust, potentially attributing features to dust that may, in fact, be closely linked to ionised or molecular gas instead.
- 2512.11042v1: MIRACLE III. JWST/MIRI expose the hidden role of the AGN outflow in NGC 1068
We modeled the ionized outflow with the kinematic tool MOKA 3 D \mathrm{MOKA^{3D}} exploiting both the [O iv ] and [O iii ] emission lines. We found velocities ≥ \geq 2000 km s − 1 \mathrm{km\,s^{-1}} and a systematic difference of 300 km s − 1 \mathrm{km\,s^{-1}} between the warm ( [O iii ] ) and highly ionized ( [O iv ] ) phases. The large FoV of MUSE allows to trace the outflow properties up to ∼ \sim 700 pc from the center, showing evidence of gas acceleration starting at ∼ \sim 500 pc from the nucleus (Fig. 7 ) consistent with recent theoretical model predictions.
- 2512.11042v1: MIRACLE III. JWST/MIRI expose the hidden role of the AGN outflow in NGC 1068
In this section we present the result of the kinematic fit of the ordered motions within the galactic disc of NGC 1068 exploiting a multi-shell fit with MOKA 3 D \mathrm{MOKA^{3D}} of MUSE data. In particular, we fit a circular thin disc with inner and outer radius of 4-50 ′′ ( ∼ \sim 0.3-3.4 kpc), divided in 46 concentric annuli of fixed width of 1 ′′ (70 pc), comparable to the MUSE FWHM. Due to the outshining outflow emission within the central 4 ′′ we could not securely identify the narrow [O iii ] component in this region and therefore set the inner disc radius to 4 ′′ scale. The fit provides the inclination and circular velocity in each shell, similarly to the procedure carried out for the outflow fit in Sect. 3.4.1 . As a result we find that the disc is inclined of 57 ∘ ± \pm 3 ∘ with respect to the LOS, consistently with previous analysis ( Bland-Hawthorn et al. 1997 ) . The circular velocity as a function of the radius is shown in Fig. 12 , showing peak velocities of ∼ \sim 250 km s − 1 \mathrm{km\,s^{-1}} , consistently with Meena et al. (2023) . We derived the dynamical mass profile in NGC 1068 from the deprojected circular velocities in each shell assuming circular motion in a spherically symmetric potential:
- 2601.06255v1: GA-NIFS: high prevalence of dusty and metal-enriched outflows in massive and luminous star-forming galaxies at $z\sim3-9$
We have identified outflows in 13 out of 15 star-forming systems. In terms of the individual galaxies/regions explored, we find outflows in 14 out of 40 of them, which translates into an outflow incidence of 35%. We ascribe this high prevalence of ionized outflows, which is larger than in previous works at similar redshifts, mainly due to the higher stellar masses (log 10 (M ⋆ /M ⊙ ) > 8.5 >8.5 ) and SFRs (log 10 ( S F R H α SFR_{\rm H\alpha} /M ⊙ yr -1 ) = [ − 0.3 , 2.5 ] [-0.3,2.5] ) of our galaxies, and the advantages provided by our deep IFS data to identify galactic outflows.
- 2601.06255v1: GA-NIFS: high prevalence of dusty and metal-enriched outflows in massive and luminous star-forming galaxies at $z\sim3-9$
The outflowing gas presents, on average, ∼ 0.59 \sim 0.59 mag higher dust attenuation and ∼ 0.13 \sim 0.13 dex higher oxygen abundances than the host galaxies, indicating that outflows entrain significant amounts of dust and metals. However, the velocities are not large enough ( v out v_{\rm out} / v esc < 1 v_{\rm esc}<1 ) for the outflowing gas to escape the host galaxies and reach the CGM, so instead they probably redistribute the gas throughout the galaxies.
- 2601.00960v1: GA-NIFS: AGN activity in a Lyα emitter within a triple-AGN system anchored by a passive galaxy at z=3
Results. LAE2 exhibits rest-frame UV–optical line ratios fully consistent with an embedded AGN. Its [O iii ] and H α \alpha emission displays a clumpy morphology and irregular, non-rotating kinematics on sub-kpc scales. Except for Ly α \alpha , LAE1 remains undetected in all nebular lines and in JWST imaging; its Ly α \alpha emission is broad ( σ ∼ 200 \sigma\sim 200 km s -1 ) and asymmetric. The similarity of the LAE1 and LAE2 Ly α \alpha profiles in both velocity and flux suggests that LAE1 traces resonantly scattered emission powered by LAE2 rather than in-situ star formation (although the latter cannot be completely ruled out).
- 2601.00960v1: GA-NIFS: AGN activity in a Lyα emitter within a triple-AGN system anchored by a passive galaxy at z=3
We have presented new JWST/NIRSpec IFS observations of the environment of the massive quiescent galaxy GS10578 at z = 3.064 z=3.064 , targeting two nearby Ly α \alpha -emitters (LAE1 and LAE2) previously identified in deep VLT/MUSE data. Combined with the MUSE cube and ancillary JWST/NIRCam imaging, our analysis provides a spatially resolved view of ionised gas, kinematics, and AGN activity within ∼ 30 \sim 30 kpc of one of the earliest quenched galaxies known at high redshift. Our main conclusions are as follows:
Abstract
We present the first spatially resolved kinematic evidence for dust in the outflows of Active Galactic Nuclei (AGN). We utilise observations from JWST with NIRSpec IFU and MIRI MRS data of 10 local Seyferts and use Principal Component Analysis (PCA) tomography to extract the kinematics of Polycyclic Aromatic Hydrocarbon (PAH) features. PAHs comprise the smallest carbonaceous dust molecules in the Interstellar Medium (ISM), and produce emission features in the infrared providing the potential to measure kinematics. This is however challenging due to their broad shapes and variations in their intrinsic profile, prompting the need for techniques such as PCA tomography. We find that the velocity of the PAHs is similar to the molecular gas as traced by the rotational transitions of H$_2$, where for NGC 5728 and NGC 7582, both disk and outflow are present. We detect the outflow in the kinematics of large and neutral PAHs, namely the 11.3 $μ$m and 17 $μ$m PAH features, where after subtracting the disk, the velocity field matches that of high-ionisation potential lines such as [NeVI] (7.65 $μ$m, IP = 158 eV). Finally, we fail to detect kinematics of the 6.2 $μ$m PAH due to an altered intrinsic profile while the the 3.3 $μ$m PAH kinematics purely trace the circumnuclear disk. This suggests the PAHs in the outflow are more neutral and larger than in star-forming regions, consistent with PAH band ratios in previous studies of AGN.
Discussion
Discussion access requires a security token. Register for the weekly digest.